
Daily Analysis
Silver (XAGUSD) | Published by Chartrick’s Team of Experienced Technical Analysts
Key Insight
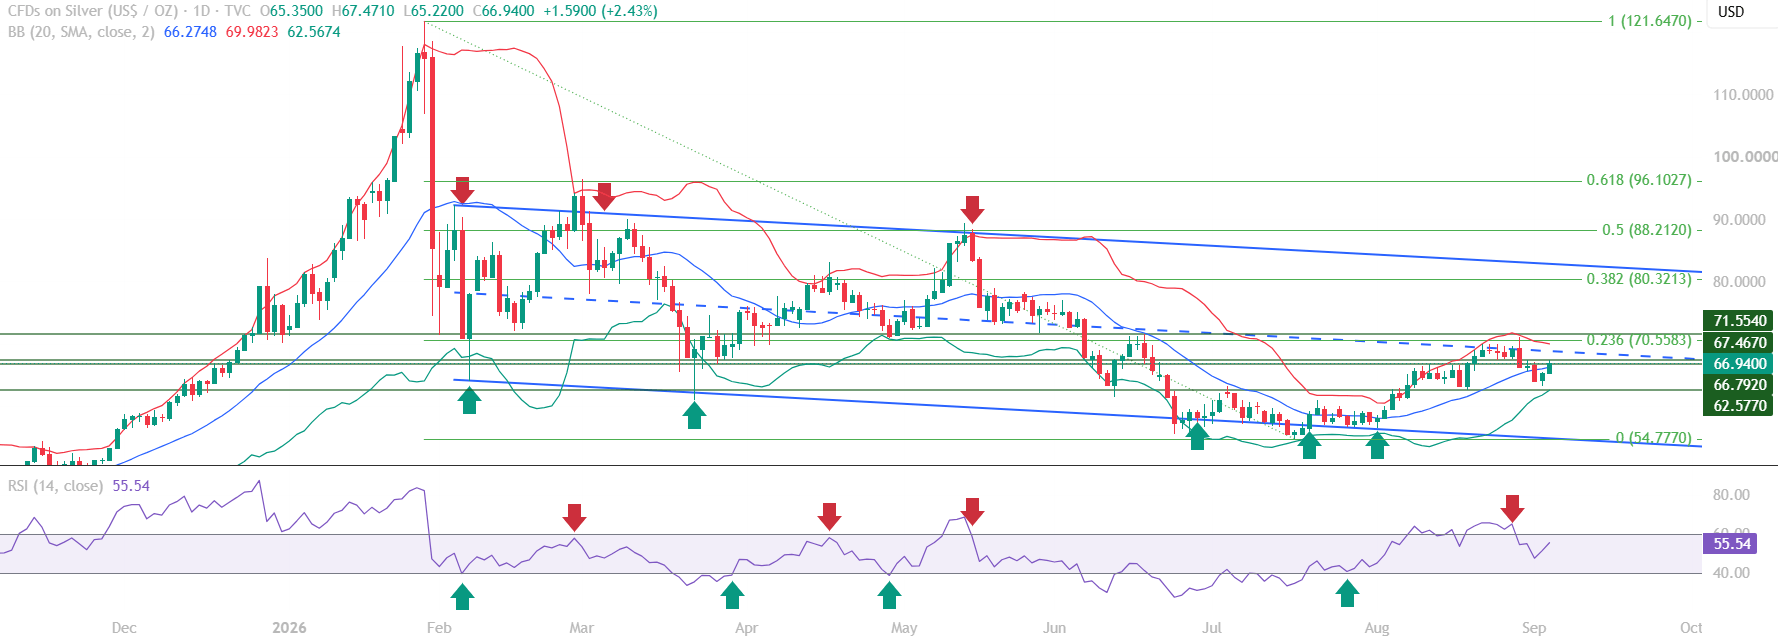
Silver remains in a broader downtrend and continues to trade within a downward-sloping trend channel. Price has bounced from the lower boundary of the channel and has marginally reclaimed the Mid Bollinger Band, indicating a short-term technical recovery within the broader downtrend. RSI remains within the 40-60 range, suggesting consolidation rather than a confirmed trend reversal. A sustained move above RSI 60, together with a sustained breakout above 70.5583, would provide stronger evidence of improving momentum and a potential structural shift.
All content on this page is educational technical chart analysis provided for informational purposes only. It does not constitute investment advice or any recommendation to buy, sell, or hold any financial instrument.
What Does the Current Silver Chart Structure Show?
This Silver (XAGUSD) educational technical chart analysis shows price trading within a downward-sloping trend channel that has been in place since February 2026. Silver has staged a technical bounce off the lower boundary of that channel, and the market sentiment remains bearish within the broader downtrend even as the near-term structure firms up. Price is currently trading above near-term support while still sitting below the key resistance levels that define the top of the recent range.
The formation of lower lows across this downtrend continues to reflect underlying structural weakness, and that pattern is the reason this bounce is being read as a technical recovery rather than a reversal. The critical reaction zone for Silver sits between 66.2748 and 70.5583 – the area between the reclaimed Mid Bollinger Band and the key Fibonacci resistance – and how price behaves inside that zone over the coming sessions will say a lot about whether the bounce extends or fades back into the downtrend.
- Price is trading inside a downward-sloping trend channel formed at the start of the broader downtrend
- Silver has marginally closed above the Mid Bollinger Band, which now acts as a key near-term support
- RSI remains within the 40-60 consolidation range rather than confirming a trend shift
- Market behaviour stays bearish within the broader downtrend while price holds above near-term support and below key resistance
- Sentiment reads as a bearish phase with a technical bounce currently in place
Why the RSI 40-60 Range Is the Signal to Watch
RSI staying capped inside the 40-60 band is the single most important read on this chart right now, because it is what separates a genuine structural shift from a routine bounce inside an intact downtrend. A sustained move above the 60 threshold would be the first real momentum confirmation that buyers are taking control rather than simply covering the deepest part of the selloff. Until that happens, the Mid Bollinger Band reclaim and the bounce off the channel’s lower boundary remain technical, near-term developments sitting inside a structure that is still, by definition, bearish. That is why Chartrick’s framework treats RSI 60 and the 70.5583 resistance as a paired confirmation, not either one in isolation.
How Are the Silver Technical Indicators Reading?
A full technical indicators reading on the current Silver chart draws on RSI, Bollinger Bands, Fibonacci retracement levels, and the trend channel itself, using a daily candlestick timeframe. Each of these tools points to the same underlying picture: a market in consolidation at the lower end of its range, with a bounce in progress but no confirmed change in the broader trend.
Read individually, the indicators break down as follows:
RSI (Relative Strength Index)
- RSI is sitting in the 40-60 range, indicating consolidation at bottom-of-range levels rather than a trend reversal
- A sustained move above the 60 level would be the first indication of improving momentum
Bollinger Bands
- Price has marginally closed above the Mid Bollinger Band, which may act as key support in the near term
Fibonacci Analysis
- 0 – 54.7770
- 0.236 – 70.5583
- 0.382 – 80.3213
- 0.5 – 88.2120
- 0.618 – 96.1027
Trend Channel
- Silver continues to trade within a downward-sloping trend channel formed since February 2026
- Price has bounced from the lower boundary of the channel, indicating a short-term technical recovery within the broader downtrend
Key Technical Levels for Silver (XAGUSD)
The levels below define the immediate reaction zone for Silver and the broader structure surrounding the current bounce.
Resistance Levels
| Resistance Type | Price Level | Notes |
|---|---|---|
| Immediate Resistance | 67.4670 | First level above CMP |
| Key Resistance | 70.5583 | Fibonacci 0.236 retracement |
| Major Resistance | 71.5540 | Upper boundary of the current reaction zone |
Support Levels
| Support Type | Price Level | Notes |
|---|---|---|
| Immediate Support | 66.7920 | Nearest support below CMP |
| Key Support | 66.2748 | Mid Bollinger Band |
| Major Support | 62.5770 | Fibonacci 0 / lower channel boundary |
Summary: Silver Technical Outlook
Silver’s technical outlook stays defined by the broader downtrend it has been trading in since February 2026, even as the current session shows a short-term technical bounce off the lower boundary of that channel. The Mid Bollinger Band reclaim and the RSI print near 55.54 are constructive near-term signals, but neither is enough on its own to mark a structural shift while RSI remains capped below 60 and price remains below the 70.5583 key resistance.
A sustained hold above the Mid Bollinger Band, followed by RSI clearing 60 and price breaking 70.5583, would be the combination that shifts this from a technical bounce to a stronger momentum case. Until then, the 66.2748 to 70.5583 zone is the range to watch for how this plays out over the next several sessions.
- CMP: 66.9400, trading between Immediate Support (66.7920) and Immediate Resistance (67.4670)
- Broader structure remains a downtrend inside a downward-sloping channel formed since February 2026
- RSI at 55.54, inside the 40-60 consolidation range
- Mid Bollinger Band (66.2748) marginally reclaimed and now acting as near-term support
- Confirmation trigger: RSI above 60 together with a break of the 70.5583 key resistance
Want Expert Analysis on a Specific Asset?
Request a custom weekly chart interpretation of Equities, Cryptos, Commodities & Indices from Chartrick’s team of experienced technical analysts. Delivered to your inbox within 2 working days.
Important Disclaimer
All content on Chartrick, including charts, analysis reports, articles, and educational materials, is provided for general informational and educational purposes only. Nothing on this platform constitutes investment advice, financial advice, trading advice, or any recommendation to buy, sell, or hold any financial instrument. Financial markets carry risk, and past chart analysis does not guarantee future performance. All analysis is based on publicly available market data and is subject to change at any time. While every effort is made to ensure accuracy, Chartrick does not accept liability for any loss, damage, or financial outcome arising directly or indirectly from use of or reliance on this content, including any errors or omissions in the analysis. Users are solely responsible for their own investment and trading decisions and should exercise their own independent judgment.





