

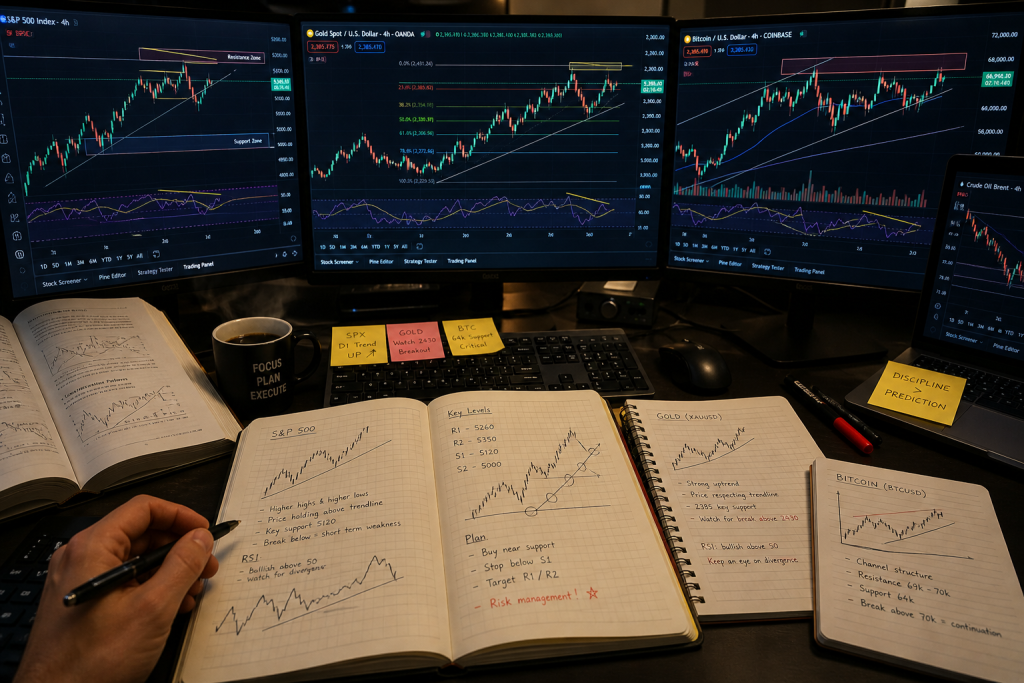
Decoding the Language of Charts
Chartrick’s team of experienced technical analysts delivers structured educational chart analysis across global equities, commodities, and cryptocurrency markets

Expert Chart Analysis for Stocks, Commodities & Cryptos
—MMM—…—
—AOS—…—
—ABT—…—
—ABBV—…—
—ACN—…—
—ADBE—…—
—AMD—…—
—AES—…—
—AFL—…—
—A—…—
—APD—…—
—ABNB—…—
—AKAM—…—
—ALB—…—
—ARE—…—
—ALGN—…—
—ALLE—…—
—LNT—…—
—ALL—…—
—GOOGL—…—
—GOOG—…—
—MO—…—
—AMZN—…—
—AMCR—…—
—AEE—…—
—AEP—…—
—AXP—…—
—AIG—…—
—AMT—…—
—AWK—…—
—MMM—…—
—AOS—…—
—ABT—…—
—ABBV—…—
—ACN—…—
—ADBE—…—
—AMD—…—
—AES—…—
—AFL—…—
—A—…—
—APD—…—
—ABNB—…—
—AKAM—…—
—ALB—…—
—ARE—…—
—ALGN—…—
—ALLE—…—
—LNT—…—
—ALL—…—
—GOOGL—…—
—GOOG—…—
—MO—…—
—AMZN—…—
—AMCR—…—
—AEE—…—
—AEP—…—
—AXP—…—
—AIG—…—
—AMT—…—
—AWK—…—
S&P 500 — Top 50 Stocks
LIVE
Sort:
Refreshes in 120s
| # | Symbol | Company | Price | Change | % Change | Volume | Vol Bar | 52W Range | Mkt Cap |
|---|---|---|---|---|---|---|---|---|---|
| 1 | AAPL |
|
|
||||||
| 2 | MSFT |
|
|
||||||
| 3 | NVDA |
|
|
||||||
| 4 | AMZN |
|
|
||||||
| 5 | META |
|
|
||||||
| 6 | GOOGL |
|
|
||||||
| 7 | GOOG |
|
|
||||||
| 8 | TSLA |
|
|
||||||
| 9 | BRK.B |
|
|
||||||
| 10 | JPM |
|
|
||||||
| 11 | LLY |
|
|
||||||
| 12 | V |
|
|
||||||
| 13 | UNH |
|
|
||||||
| 14 | AVGO |
|
|
||||||
| 15 | XOM |
|
|
||||||
| 16 | MA |
|
|
||||||
| 17 | COST |
|
|
||||||
| 18 | JNJ |
|
|
||||||
| 19 | HD |
|
|
||||||
| 20 | PG |
|
|
||||||
| 21 | WMT |
|
|
||||||
| 22 | ABBV |
|
|
||||||
| 23 | BAC |
|
|
||||||
| 24 | MRK |
|
|
||||||
| 25 | CVX |
|
|
||||||
| 26 | KO |
|
|
||||||
| 27 | NFLX |
|
|
||||||
| 28 | CRM |
|
|
||||||
| 29 | PEP |
|
|
||||||
| 30 | TMO |
|
|
||||||
| 31 | ORCL |
|
|
||||||
| 32 | AMD |
|
|
||||||
| 33 | ACN |
|
|
||||||
| 34 | MCD |
|
|
||||||
| 35 | CSCO |
|
|
||||||
| 36 | ABT |
|
|
||||||
| 37 | DHR |
|
|
||||||
| 38 | TXN |
|
|
||||||
| 39 | WFC |
|
|
||||||
| 40 | ADBE |
|
|
||||||
| 41 | LIN |
|
|
||||||
| 42 | NKE |
|
|
||||||
| 43 | NEE |
|
|
||||||
| 44 | PM |
|
|
||||||
| 45 | QCOM |
|
|
||||||
| 46 | AMGN |
|
|
||||||
| 47 | RTX |
|
|
||||||
| 48 | SPGI |
|
|
||||||
| 49 | CAT |
|
|
||||||
| 50 | GE |
|
|
Last updated: —
Data via Yahoo Finance · For informational use only
Global Assets We Analyze
Chartrick's team of experienced technical analysts publishes daily educational technical chart analysis across the following core markets. Our analytical coverage is focused on, but not limited to, these assets


About Chartrick
A Global Platform. A Dedicated Team. One Discipline.

Custom Chart Analysis
Personalized technical charts based on your requirements.
On-Demand Insights
Quick, accurate chart analysis whenever you need it.
Chartrick is a research-driven educational technical chart analysis platform built by a dedicated team of experienced technical analysts. We deliver structured, objective chart interpretation across the world's most actively tracked financial markets — equities, commodities, and cryptocurrency.
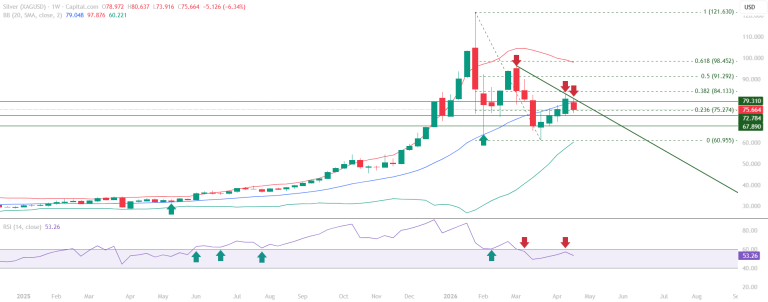
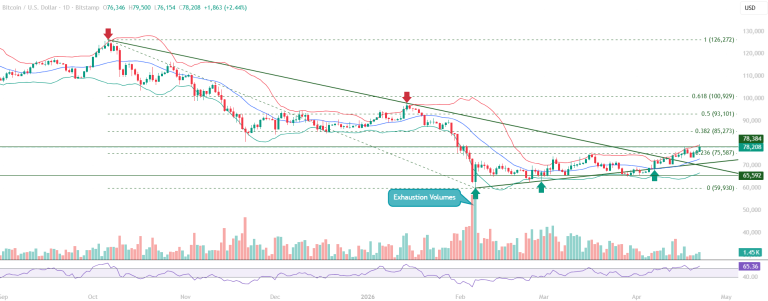
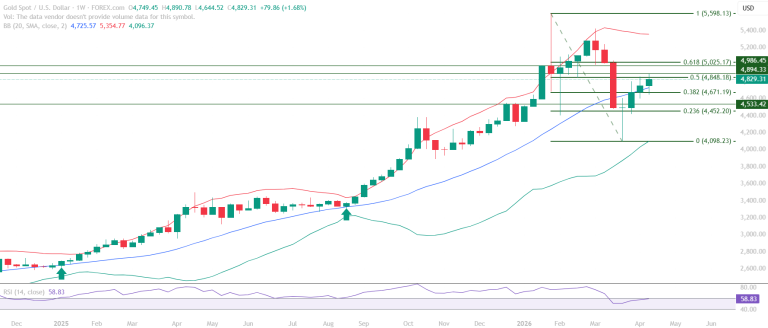
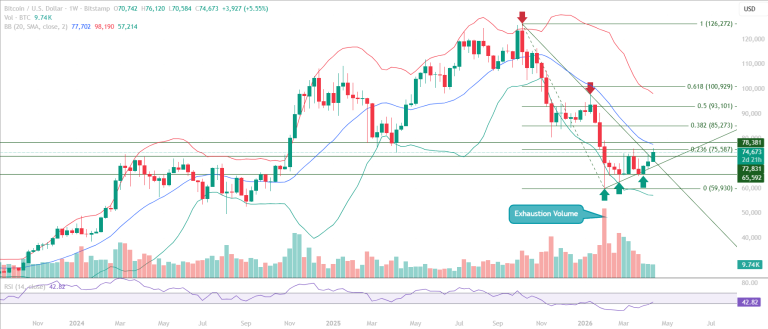
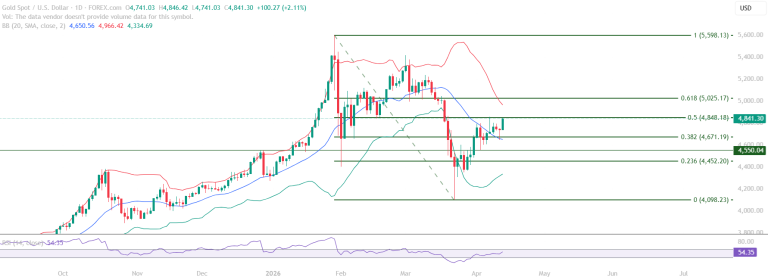
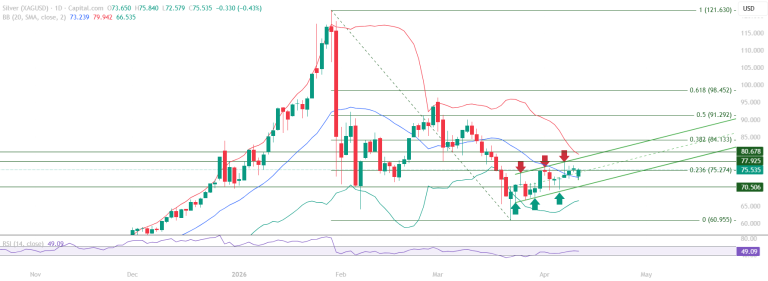
Our team examines the assets that define global market direction: the S&P 500(SPX), Gold (XAUUSD), Silver (XAGUSD), Brent Crude Oil, and Bitcoin (BTCUSD). Every analysis published on Chartrick is grounded in publicly available market data, structured around proven technical frameworks, and delivered strictly for educational purposes.
We are not a signals service. We are not an advisory firm. We are a team of experienced technical analysts focused on one thing: decoding what the charts are saying.
The Chartrick team brings focused expertise across global equities, commodities, and cryptocurrency markets. Our analysts are dedicated exclusively to technical chart interpretation — examining price structure, identifying key levels, and delivering analysis that equips investors with a clear, objective understanding of what the charts are communicating.
What Sets Chartrick Apart:
- A dedicated team of experienced technical analysts covering five major global markets daily
- Structured, objective analysis built on publicly available market data
- Educational technical chart analysis across equities, commodities, and cryptocurrency
- Consistent methodology applied across all assets and all timeframes
- Analysis published daily across multiple platforms for global reach.
Custom Chart Analysis
Personalized technical charts based on your requirements.
On-Demand Insights
Quick, accurate chart analysis whenever you need it.
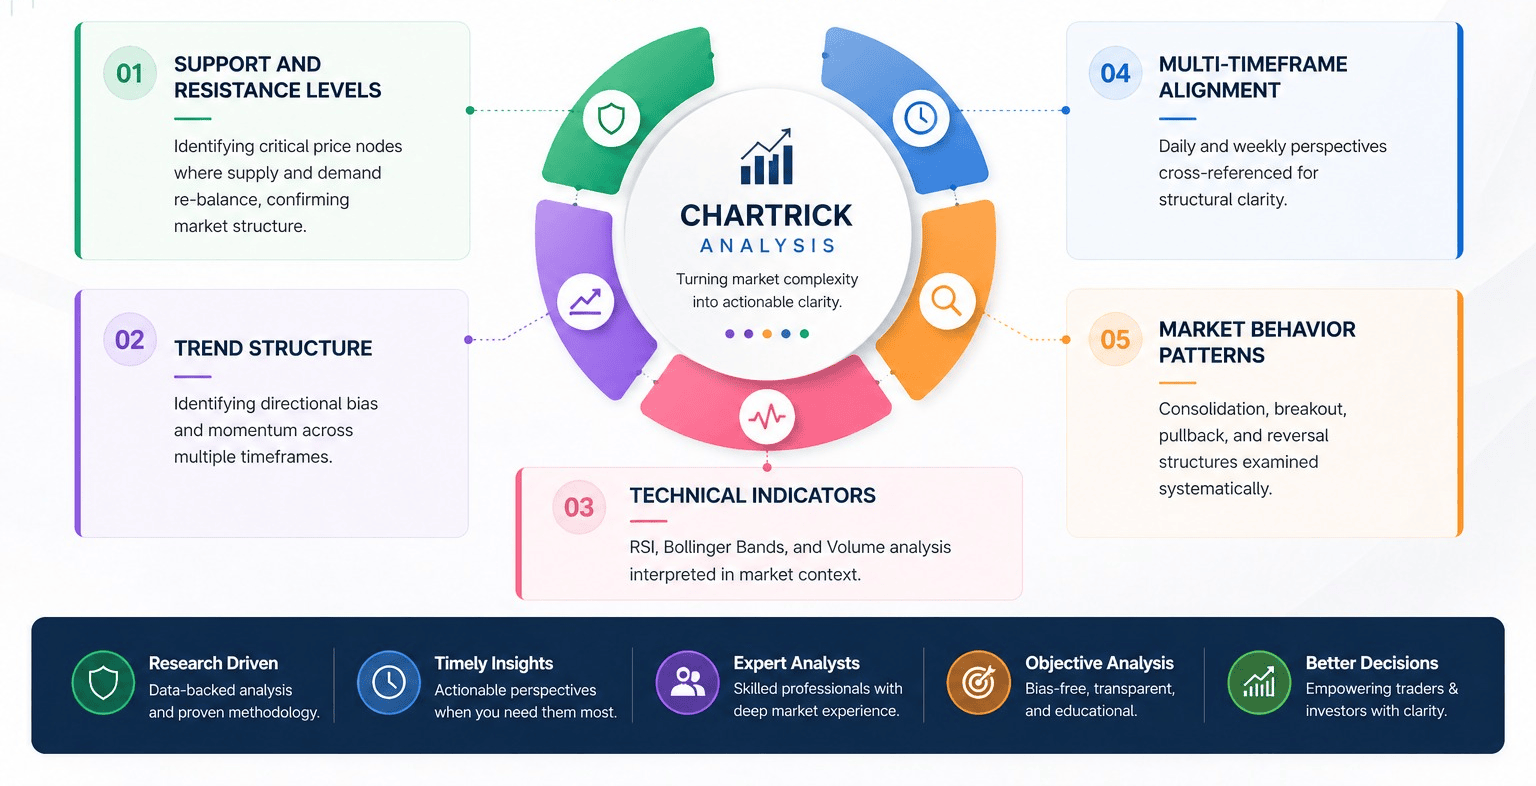
Our Analytical Approach
At Chartrick, we combine technical expertise with a systematic framework to deliver high-quality chart analysis across global markets.
Financial markets are shaped by structure, liquidity, sentiment, and volatility. Educational technical chart analysis is the discipline of reading these forces objectively, and Chartrick's team of experienced technical analysts is built to do exactly that.
Our analytical framework is consistent, structured, and applied uniformly across every asset we cover:
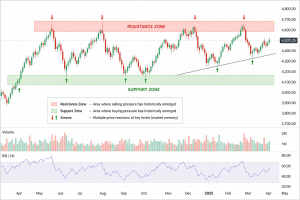
- Trend Structure: Identifying directional bias and momentum across multiple timeframes
- Support and Resistance Levels: Pinpointing key price zones where market behavior shifts
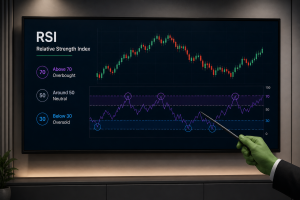
- Technical Indicators: RSI, Bollinger Bands, and Volume analysis interpreted in market context
- Market Behavior Patterns: Consolidation, breakout, pullback, and reversal structures examined systematically
- Multi-Timeframe Alignment: Daily and weekly perspectives cross-referenced for structural clarity
All analysis published on Chartrick is educational technical chart analysis based on publicly available market data. Chartrick does not provide investment advice, trading signals, or recommendations of any kind.
Financial markets are shaped by structure, liquidity, sentiment, and volatility. Educational technical chart analysis is the discipline of reading these forces objectively, and Chartrick's team of experienced technical analysts is built to do exactly that.
Our analytical framework is consistent, structured, and applied uniformly across every asset we cover:
Our analytical framework is consistent, structured, and applied uniformly across every asset we cover:
- Trend Structure: Identifying directional bias and momentum across multiple timeframes
- Support and Resistance Levels: Pinpointing key price zones where market behavior shifts
- Technical Indicators: RSI, Bollinger Bands, and Volume analysis interpreted in market context
- Market Behavior Patterns: Consolidation, breakout, pullback, and reversal structures examined systematically
- Multi-Timeframe Alignment: Daily and weekly perspectives cross-referenced for structural clarity

Get Custom Chart Analysis at $15*
Request expert educational technical chart analysis for a specific asset. Chartrick’s team of expert analysts delivers custom weekly chart interpretation covering critical support and resistance levels, trend structure, and market behavior analysis, delivered directly to your inbox within 2 working days.
*multiple plans available starting 15 USD

Latest Market Analysis
Access the latest educational technical chart analysis published daily by Chartrick's team of experienced technical analysts across various assets.
📊
No Market Analysis Available
There are no posts matching your selected filters.
Try selecting a different category.

Expert Structured Market Analysis Built on Educational Technical Chart Analysis
Financial markets are shaped by structure, liquidity, sentiment, and volatility. Educational technical chart analysis is the discipline of reading these forces objectively, and Chartrick is built to do exactly that.
Our expert analytical approach focuses on:
- Trend structure and directional bias across timeframes
- Support and resistance levels at key price zones
- Indicators including RSI, Bollinger Bands, and Volume analysis
- Market behavior patterns: higher highs, lower lows, consolidation, breakout, and pullback structures
All analysis published on Chartrick is educational technical chart analysis based on publicly available market data. Chartrick does not provide investment advice or trading recommendations.
The Analyst's Edge
Chartrick's team of experienced technical analysts shares educational perspectives on chart reading, market structure, and technical analysis methodology — designed to sharpen how you interpret financial markets.
04
May

02
May

01
May