Weekly Analysis
Bitcoin (BTC USD) | Published by Chartrick’s Team of Experienced Technical Analysts
14 September – 20 September 2026
77,283 (as on week closed on 13 September 2026)
Potential Trend Reversal Within a Broader Downtrend
Key Insight
Bitcoin remains within a broader bearish structure but has developed a potential trend-reversal setup from the consolidation base formed at recent lows. Price has reclaimed the 0.236 Fibonacci level at 73,909 and is trading above the broken downward-sloping trendline and Mid Bollinger Band.
RSI has recovered to 55.16 but remains below the key 60 momentum threshold. The 73,909-83,916 region, including the 82,193 key resistance level and 83,916 Fibonacci resistance, will be critical in determining whether the recovery develops into a stronger reversal or remains a technical bounce.
All content on this page is educational technical chart analysis provided for informational purposes only. It does not constitute investment advice or any recommendation to buy, sell, or hold any financial instrument.
What Does the Current Bitcoin Chart Structure Show?
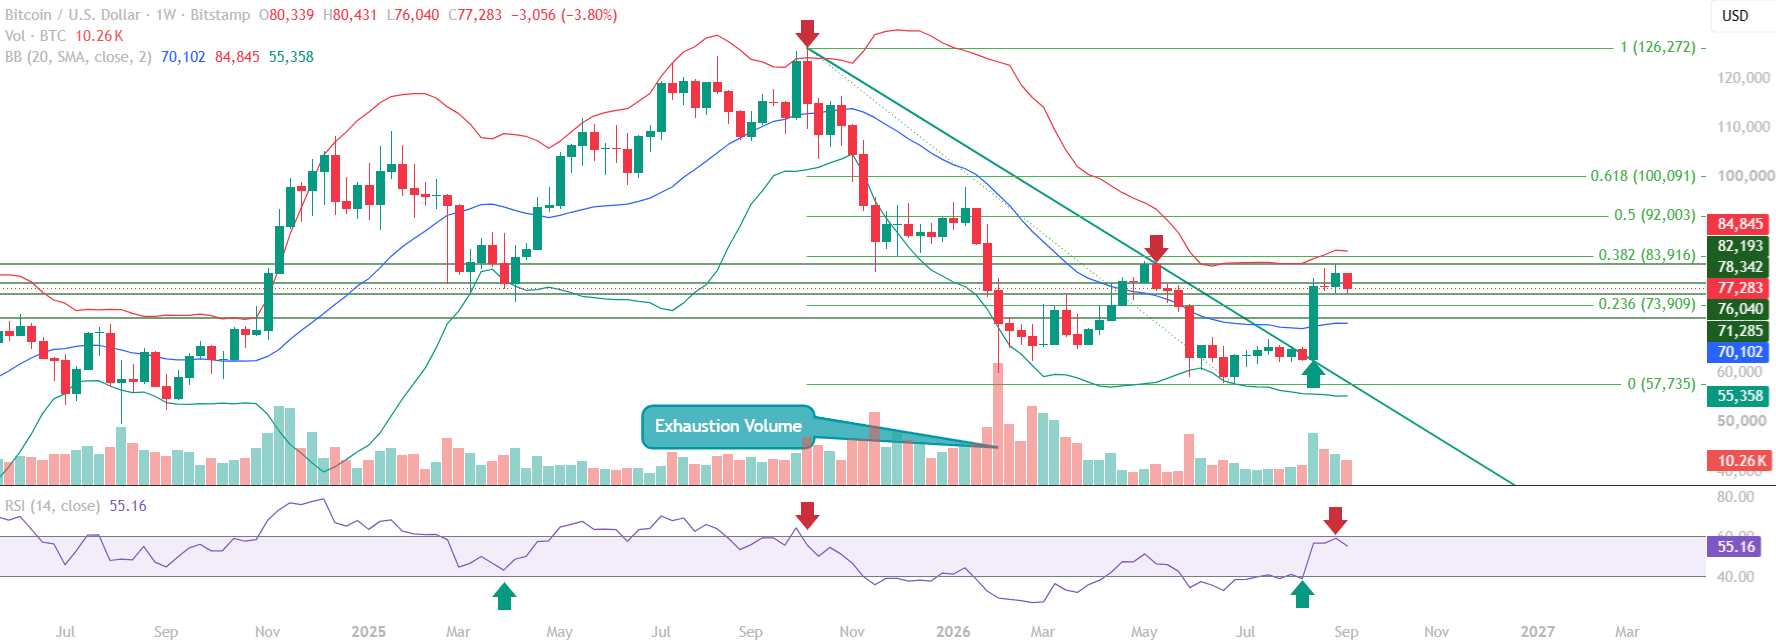
The weekly Bitcoin (BTC) chart shows price recovering from the consolidation base formed at recent lows. This base formation suggests demand has emerged at lower levels and has created an early potential trend-reversal setup within the broader bearish structure.
Price has reclaimed the 73,909 Fibonacci 0.236 level and is trading above the broken downward-sloping trendline and the Mid Bollinger Band at 70,102. These developments indicate improving short-term structure, although the latest weekly candle shows rejection from higher levels and confirmation of a broader reversal is still pending.
- Solid base formation developing at recent lows
- Price trading above the broken downward-sloping trendline
- Price has reclaimed the 73,909 Fibonacci 0.236 level
- Bitcoin is trading above the Mid Bollinger Band at 70,102
- RSI has recovered to 55.16 but remains below the key 60 threshold
- Elevated volume during the prior decline may indicate exhaustion of selling pressure
- 73,909-82,193 is the critical zone for the current recovery structure
Why the 73,909-82,193 Zone Matters
The 73,909-82,193 range is the critical reaction zone for Bitcoin this week. The 73,909 level acts as key support following its recovery above the Fibonacci 0.236 retracement, while 82,193 represents the key resistance that must be overcome for the recovery structure to gain further strength.
Sustained acceptance above the 78,342-82,193 resistance region would strengthen the trend-reversal setup. A decisive move above 83,916, the Fibonacci 0.382 resistance, combined with RSI sustaining above 60, would provide stronger confirmation of a broader structural shift.
How Are the Technical Indicators Reading?
The Bitcoin educational technical chart analysis uses RSI, Bollinger Bands, Fibonacci retracement levels, volume and trendlines on the weekly candlestick chart. Together, these indicators point to improving short-term structure while the broader downtrend remains relevant.
Momentum has improved from lower levels, with RSI recovering toward 60. Price has also reclaimed the broken downward-sloping trendline and moved above the Mid Bollinger Band. However, the recovery still requires confirmation through sustained momentum and acceptance above the key resistance levels.
RSI
RSI previously found support around the 40 level and has since recovered to 55.16. Momentum is therefore improving, but RSI remains below the key 60 threshold. A sustained weekly RSI reading above 60 would provide stronger confirmation that the recovery is gaining momentum.
Bollinger Bands
Bitcoin is trading well above the Mid Bollinger Band at 70,102, which may act as an important support zone in the near term. Maintaining price above this level would support the current recovery structure, while a sustained move back below it would weaken the short-term setup.
Fibonacci Analysis
The Fibonacci retracement structure places the 0 level at 57,735, the 0.236 level at 73,909, the 0.382 level at 83,916, the 0.5 level at 92,003 and the 0.618 level at 100,091. The 73,909 level is currently the key Fibonacci support, while 83,916 represents the major Fibonacci resistance for the recovery.
Volume
Elevated volume during the prior decline, followed by limited further downside, may indicate exhaustion of selling pressure and the early formation of a base. Stronger upside volume alongside sustained acceptance above resistance would provide additional confirmation that the recovery is developing into a broader structural shift.
Trendline
Price has reclaimed the broken downward-sloping trendline that formed during the broader downtrend. Continued acceptance above this trendline will be important in determining whether the current recovery gains further momentum and develops into a confirmed trend reversal.
Key Technical Levels for Bitcoin (BTC)
The following support and resistance levels are identified in this Bitcoin (BTC) educational technical chart analysis. All levels are derived from expert chart analysis using publicly available market data.
Resistance Levels
| Resistance Type | Price Level | Notes |
|---|---|---|
| Immediate Resistance | 78,342 | Near-term resistance above current price |
| Key Resistance | 82,193 | Key resistance within the current recovery zone |
| Major Resistance | 83,916 | Fibonacci 0.382 resistance |
Support Levels
| Support Type | Price Level | Notes |
|---|---|---|
| Immediate Support | 76,040 | Immediate support below current price |
| Key Support | 73,909 | Fibonacci 0.236 retracement |
| Strong Support | 71,285 | Strong support below the key Fibonacci level |
Summary: Bitcoin Technical Outlook
This Bitcoin (BTC) educational technical chart analysis for September 14 to September 20, 2026 identifies a market showing early signs of structural strength while remaining within a broader downtrend. Price has recovered from the recent consolidation base, reclaimed the descending trendline and moved above the Mid Bollinger Band at 70,102.
RSI has recovered to 55.16 but remains below the key 60 threshold. The 73,909-82,193 zone is the critical area to watch this week. Holding above 73,909 would keep the recovery structure intact, while sustained acceptance above 78,342 and 82,193 would strengthen the reversal case. A decisive breakout above 83,916, supported by RSI sustaining above 60, would provide stronger confirmation of a broader trend reversal.
Failure to hold 73,909 could weaken the recovery structure and expose the 71,285 support zone. Until the key resistance levels are decisively reclaimed, the broader downtrend remains the longer-term structural context.
- Chart structure: potential trend reversal within a broader downtrend
- Solid base formation developing at recent lows
- Price has reclaimed the 73,909 Fibonacci 0.236 level
- Bitcoin is trading above the broken downward-sloping trendline
- Mid Bollinger Band at 70,102 is now an important support reference
- RSI at 55.16, approaching the key 60 momentum threshold
- Immediate resistance at 78,342 and key resistance at 82,193
- Major resistance at 83,916, representing Fibonacci 0.382
- Failure to hold 73,909 could expose 71,285
- A sustained RSI move above 60 alongside a breakout above 83,916 would strengthen the broader reversal case
Want Expert Analysis on a Specific Asset?
Request a custom weekly chart interpretation of Equities, Cryptos, Commodities & Indices from Chartrick’s team of experienced technical analysts. Delivered to your inbox within 2 working days.
Important Disclaimer
All content on Chartrick, including charts, analysis reports, articles, and educational materials, is provided for general informational and educational purposes only. Nothing on this platform constitutes investment advice, financial advice, trading advice, or any recommendation to buy, sell, or hold any financial instrument. Financial markets carry risk, and past chart analysis does not guarantee future performance. All analysis is based on publicly available market data and is subject to change at any time. While every effort is made to ensure accuracy, Chartrick does not accept liability for any loss, damage, or financial outcome arising directly or indirectly from use of or reliance on this content, including any errors or omissions in the analysis. Users are solely responsible for their own investment and trading decisions and should exercise their own independent judgment.