
S&P 500 Weekly Technical Analysis: Correction Within Broader Uptrend (09 – 13 November 2026)
Weekly Analysis
S&P 500 (SPX) | Published by Chartrick’s Team of Experienced Technical Analysts
Key insight
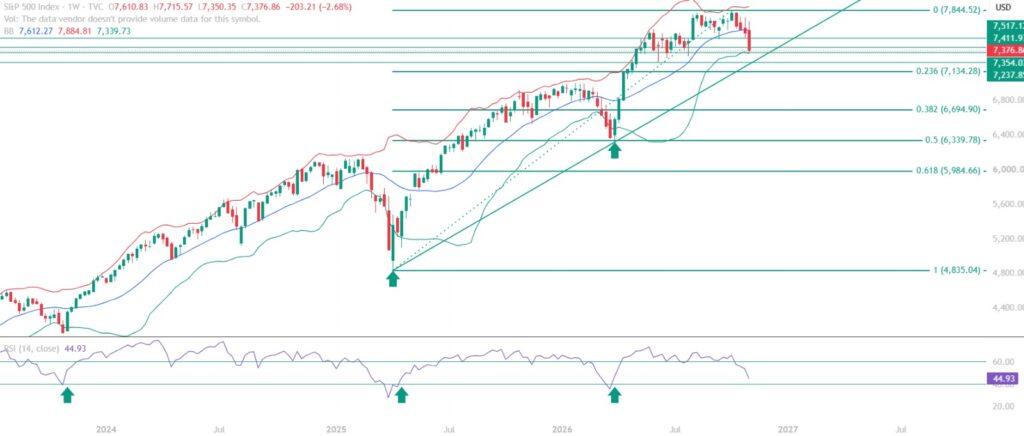
S&P 500 (SPX) educational technical chart analysis for the week of 09 November – 13 November 2026 centres on a sharp weekly sell-off of 2.68%. Price failed to sustain above the middle Bollinger Band at 7,612.27, lost the RSI 60 threshold, and now trades at 7,376.86 as it approaches an important ascending trendline that originates from the broader bull-market structure.
The foundational context for this S&P 500 chart analysis is that the broader higher-highs and higher-lows structure remains intact despite the pullback. RSI at 44.93 is approaching the key 40 momentum support zone, an area where the index found support previously. The coming weeks will be important in determining whether these technical factors can provide support and contain the ongoing correction.
All content on this page is educational technical chart analysis provided for informational purposes only. It does not constitute investment advice or any recommendation to buy, sell, or hold any financial instrument.
What Does the Current S&P 500 (SPX) Chart Structure Show?
The weekly S&P 500 (SPX) chart reflects a correction within a broader uptrend. The index continues to maintain its pattern of higher highs and higher lows, yet recent selling pressure has weakened short-term momentum. Market sentiment is cautious amid geopolitical uncertainties.
Within that corrective phase, price is trading below the middle Bollinger Band at 7,612.27 and approaching the ascending trendline. The recent weekly low of 7,350.35 also indicates that immediate support around 7,354.03 has been tested, which makes the nearby support and resistance levels the key reference points for the week ahead.
- Higher-highs and higher-lows formation remains intact in the broader structure
- A weekly decline of 2.68% has taken price to 7,376.86
- Price is trading below the middle Bollinger Band at 7,612.27
- Price is approaching the ascending trendline from the broader bull-market structure
- The weekly low of 7,350.35 tested immediate support around 7,354.03
Why the Ascending Trendline and RSI 40 Zone Matter
The ascending trendline and the RSI 40 zone are the two signals that stand out in this S&P 500 technical analysis because both are being approached at the same time. The trendline originates from the broader bull-market structure, while the RSI 40 level is the momentum support zone where the index found support previously. When a price structure and a momentum reading near important reference levels together, the reaction at those levels carries more information than either signal alone. A sustained hold above the ascending trendline and a recovery in momentum would support the case for stabilisation, while a decisive breakdown below key support could expose the index to a deeper correction.
How Are the Technical Indicators Reading?
RSI analysis in this S&P 500 educational technical chart analysis shows the momentum indicator at 44.93, down from above 60 and reflecting weakening momentum. The index remains above the key 40 threshold, which may act as an important momentum support zone. A sustained recovery above 60 would indicate improving momentum and strengthen the case for continuation of the broader uptrend.
The Bollinger Bands tell a similar short-term story, with price trading below the middle band at 7,612.27. The Fibonacci retracement levels give the wider structure its reference points, running from 0.000 at 7,844.52 down through 0.236 at 7,134.28, 0.382 at 6,694.90, 0.500 at 6,339.78 and 0.618 at 5,984.66.
- RSI at 44.93, down from above the 60 threshold
- RSI 40 threshold remains the key momentum support reference
- Price below the middle Bollinger Band at 7,612.27 signals weakening short-term momentum
- Fibonacci 0.000 at 7,844.52 and 0.236 at 7,134.28 frame the upper and lower reference levels
Key Technical Levels for S&P 500 (SPX)
The following levels are identified in this S&P 500 educational technical chart analysis. All levels are derived from expert chart analysis using publicly available market data.
Resistance Levels
| Resistance Type | Price Level | Notes |
|---|---|---|
| Immediate Resistance | 7,411.97 | Immediate resistance above current price |
| Key Resistance | 7,517.12 | Key resistance and upper boundary of the critical zone |
| Major Resistance | 7,844.52 | Fibonacci 0.000 level, major overhead reference |
Support Levels
| Support Type | Price Level | Notes |
|---|---|---|
| Immediate Support | 7,354.03 | Weekly low of 7,350.35 tested this area |
| Key Support | 7,237.85 | Key support and lower boundary of the critical zone |
| Major Support | 7,134.28 | Fibonacci 0.236 level |
Summary: S&P 500 Technical Outlook
This S&P 500 (SPX) educational technical chart analysis for the week of 09 November – 13 November 2026 describes a correction within a broader uptrend. After a weekly decline of 2.68%, price at 7,376.86 sits below the middle Bollinger Band at 7,612.27, with RSI at 44.93 reflecting weakening momentum while the higher-highs and higher-lows structure remains intact.
The critical zone for monitoring the next directional move spans 7,237.85 – 7,517.12, a support-to-resistance range. A recovery above immediate resistance at 7,411.97 would indicate improving short-term price structure, while further downside remains possible if the ascending trendline and key support levels fail to hold. Risk factors cited in the analysis include geopolitical tensions, US Dollar movement, global demand outlook, and US monetary policy and interest-rate expectations.
- Correction within a broader uptrend after a 2.68% weekly decline
- Price is below the middle Bollinger Band at 7,612.27
- RSI at 44.93 is approaching the key 40 momentum support zone
- Immediate resistance at 7,411.97 and immediate support at 7,354.03 frame the near-term range
- Critical zone for the next directional move: 7,237.85 – 7,517.12
Want Expert Analysis on a Specific Asset?
Request a custom weekly chart interpretation of Equities, Cryptos, Commodities & Indices from Chartrick’s team of experienced technical analysts. Delivered to your inbox within 2 working days.
Important Disclaimer
All content on Chartrick, including charts, analysis reports, articles, and educational materials, is provided for general informational and educational purposes only. Nothing on this platform constitutes investment advice, financial advice, trading advice, or any recommendation to buy, sell, or hold any financial instrument. Financial markets carry risk, and past chart analysis does not guarantee future performance. All analysis is based on publicly available market data and is subject to change at any time. While every effort is made to ensure accuracy, Chartrick does not accept liability for any loss, damage, or financial outcome arising directly or indirectly from use of or reliance on this content, including any errors or omissions in the analysis. Users are solely responsible for their own investment and trading decisions and should exercise their own independent judgment.