Bitcoin Reclaims Trendline as RSI Nears 60: Strong Signal
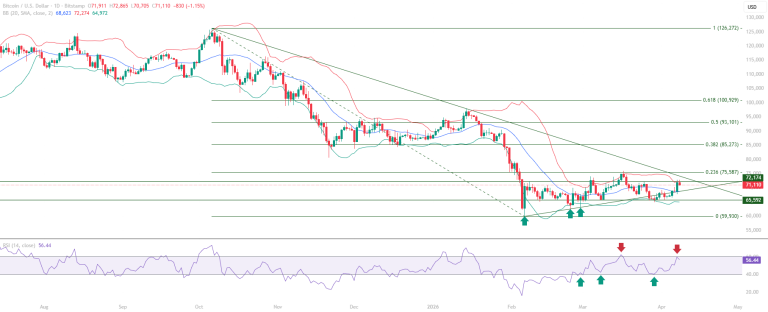
This Bitcoin chart analysis examines the quality of the current consolidation within the 59,930 to 75,587 range.The base formation pattern built over successive weeks continues to develop.

This Bitcoin chart analysis examines the quality of the current consolidation within the 59,930 to 75,587 range.The base formation pattern built over successive weeks continues to develop.
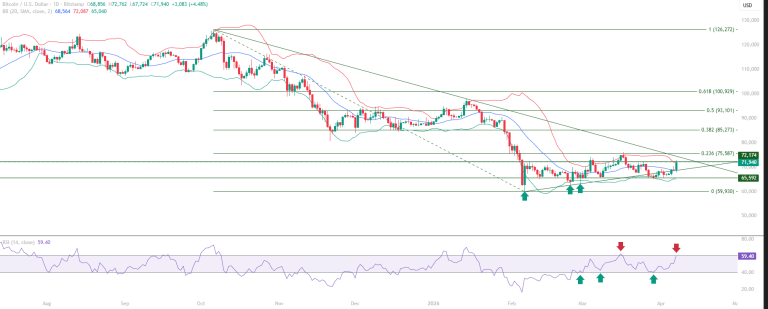
This Bitcoin chart analysis examines the base formation structure within the 59,930 to 75,587 consolidation range. The trendline reclaim is the defining structural event
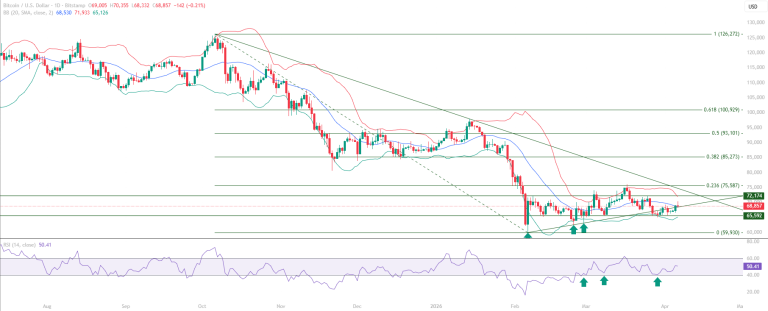
This Bitcoin chart analysis examines the 65,592 to 72,174 zone as the immediate reaction area within the broader 59,930 to 75,587 consolidation range.
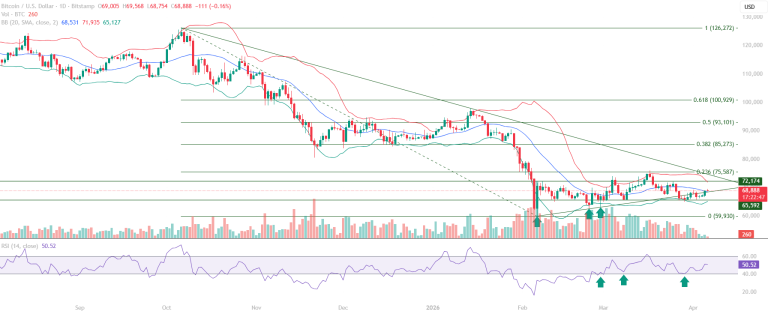
This Bitcoin chart analysis examines the structural significance of the RSI 40 pattern observed in the current consolidation.





