Gold Approaches Key Resistance – Momentum Builds from Strong Support Zone
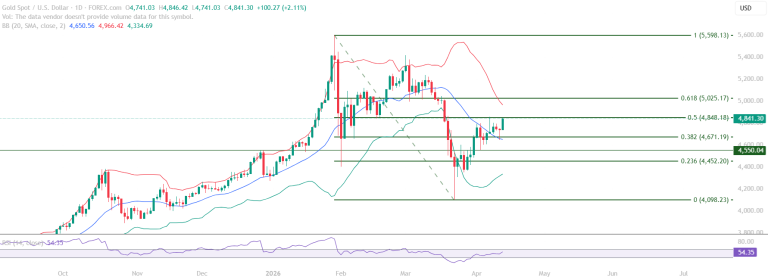
Gold chart analysis identifies a market in a defined bounce phase, approaching the Fibonacci 0.50 resistance at 4,848.18 with RSI at 54.35

Gold chart analysis identifies a market in a defined bounce phase, approaching the Fibonacci 0.50 resistance at 4,848.18 with RSI at 54.35
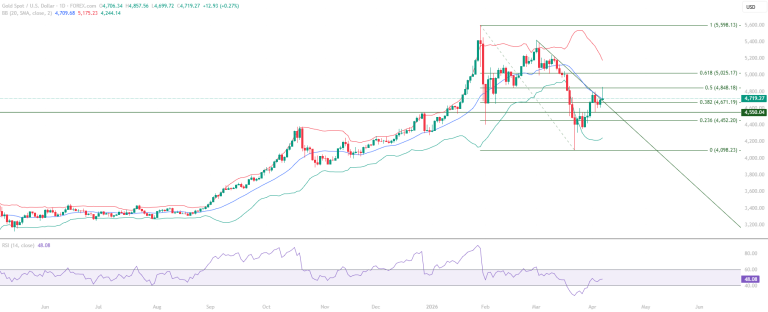
The Gold chart analysis: Implications of the Fibonacci 0.50 rejection, the interaction with the Mid Bollinger Band and downward sloping trendline.
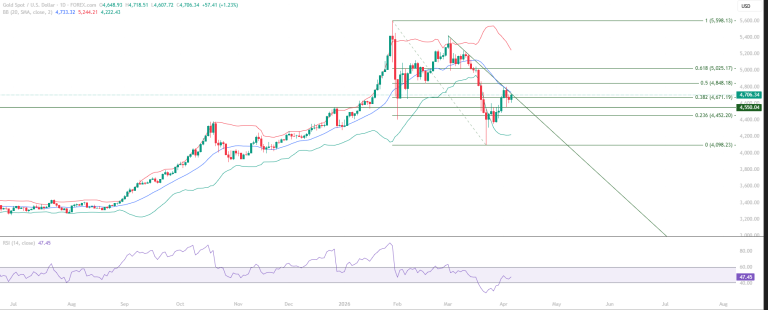
Gold educational technical chart analysis identifies a sharp recovery structure following a decisive retest of the 4,550 support level.
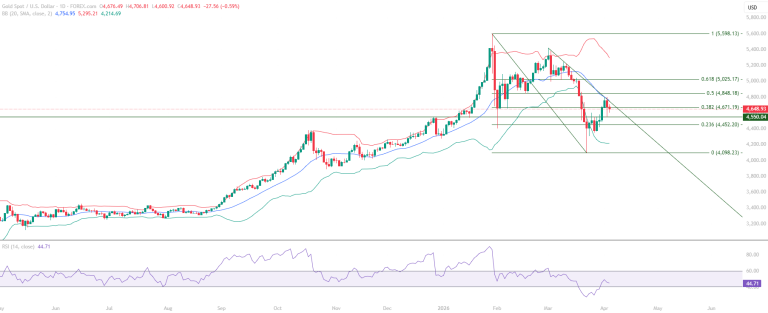
Gold (XAUUSD) educational technical chart analysis identifies a strong recovery structure from the 4,550 support level
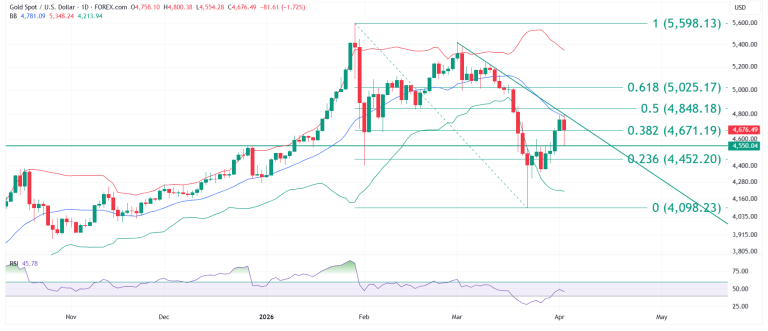
Gold analysis identifies a sharp recovery from the 4,550 support level, with price rallying from the 4,100 low to the 4,800 zone.





