
Weekly Analysis
Silver (XAGUSD) | Published by Chartrick’s Team of Experienced Technical Analysts
Opening paragraph
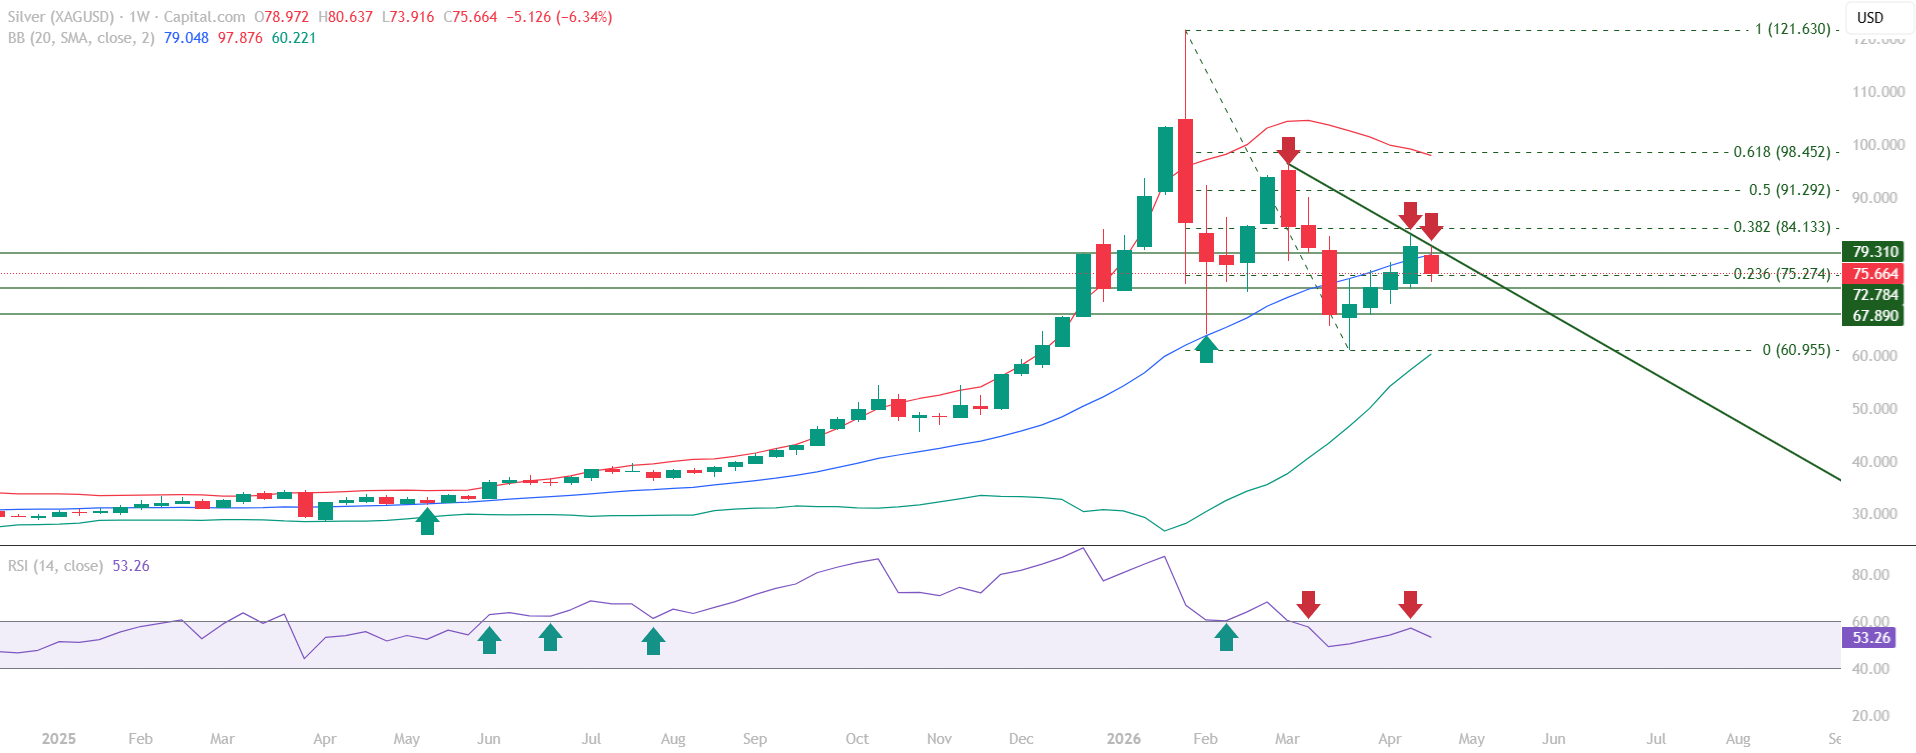
Silver has run into a wall of technical resistance – the RSI 60 level, the Mid Bollinger Band at 79.048, and a downward sloping trendline are all converging at the same zone, creating a confluence rejection that has kept the bounce phase contained within the broader corrective structure.
All content on this page is educational technical chart analysis provided for informational purposes only. It does not constitute investment advice or any recommendation to buy, sell, or hold any financial instrument.
The Structural Picture
Price recovered from lows and closed above the Fibonacci 0.236 level at 75.274, confirming buying interest from lower levels. However, the rally stalled at the 79.048 Mid Bollinger Band – a level that has structurally transitioned from support to resistance following the breakdown. The RSI simultaneously failed to reclaim the 60 level, reinforcing the rejection signal from this zone. The downward sloping trendline sits directly overhead, completing a triple confluence of resistance.
- Price closed above Fibonacci 0.236 at 75.274 – confirms buying interest from lower levels
- Rally stalled at the 79.048 Mid Bollinger Band – support-turned-resistance following the breakdown
- Downward sloping trendline sits directly overhead, completing the confluence
The Triple Confluence Resistance Zone
RSI 60, the Mid Bollinger Band at 79.048, and the downward sloping trendline are all converging in the same zone. This triple confluence is the most significant structural feature in the current Silver chart – it’s what has capped the bounce and kept the broader move classified as consolidation rather than a trend reversal.
Momentum and Indicators
RSI failing to hold above 60 indicates that bullish momentum has not established sufficient strength for continuation. On the downside, the RSI 40 level becomes the critical momentum support to monitor during any near-term pullback. Bollinger Band structure confirms the Mid Band has transitioned to resistance – a structurally bearish signal.
- RSI failed to hold above 60 – bullish momentum lacks continuation strength
- RSI 40 is the critical momentum support to watch on any near-term pullback
- Mid Bollinger Band confirmed as resistance – structurally bearish signal
- Fibonacci 0.236 at 75.274 is immediate support, with price oscillating within the 79.048–79.310 resistance confluence above; the broader Fibonacci range spans 0 at 60.955 to 0.618 at 98.452
Key Technical Levels for Silver (XAGUSD)
The levels below outline the immediate, key, and major resistance and support zones currently in play for Silver (XAGUSD).
Resistance Levels
| Resistance Type | Price Level | Notes |
|---|---|---|
| Immediate Resistance | 79.048 | Mid Bollinger Band |
| Key Resistance | 79.310 | Key resistance |
| Major Resistance | 84.133 | Major resistance |
Support Levels
| Support Type | Price Level | Notes |
|---|---|---|
| Immediate Support | 75.274 | Fibonacci 0.236 |
| Key Support | 72.784 | Key support |
| Major Support | 67.890 | Major support |
Summary: Silver Technical Outlook
The current weekly structure reflects a bounce phase within a broader corrective/downtrend context. The critical consolidation zone of 72.784–79.310 remains intact, with price yet to deliver a directional break. A sharp bounce remains a risk, but the structural evidence continues to support a corrective bias as long as price holds below the trendline and Mid Bollinger Band confluence. The convergence of the trendline, Mid Bollinger Band, and key resistance at 79.048–79.310 creates a technically significant zone worth watching for any weekly close that would challenge the broader structure.
- Bounce phase intact within a broader corrective/downtrend structure
- Consolidation zone of 72.784–79.310 remains the range to watch
- A weekly close above the 79.048–79.310 confluence would be the key signal that challenges the current corrective bias





