• Home
  • About us
  • Market Analysis
  • Get Custom Chart Analysis
  • The Analyst’s Edge
  • Contact Us
CT_logo. CT_logo.
  • Home
  • About us
  • Market Analysis
  • Get Custom Chart Analysis
  • The Analyst’s Edge
  • Contact Us
Explore More

Day: May 1, 2026

technical chart analysis showing support and resistance zones with price reacting at key levels
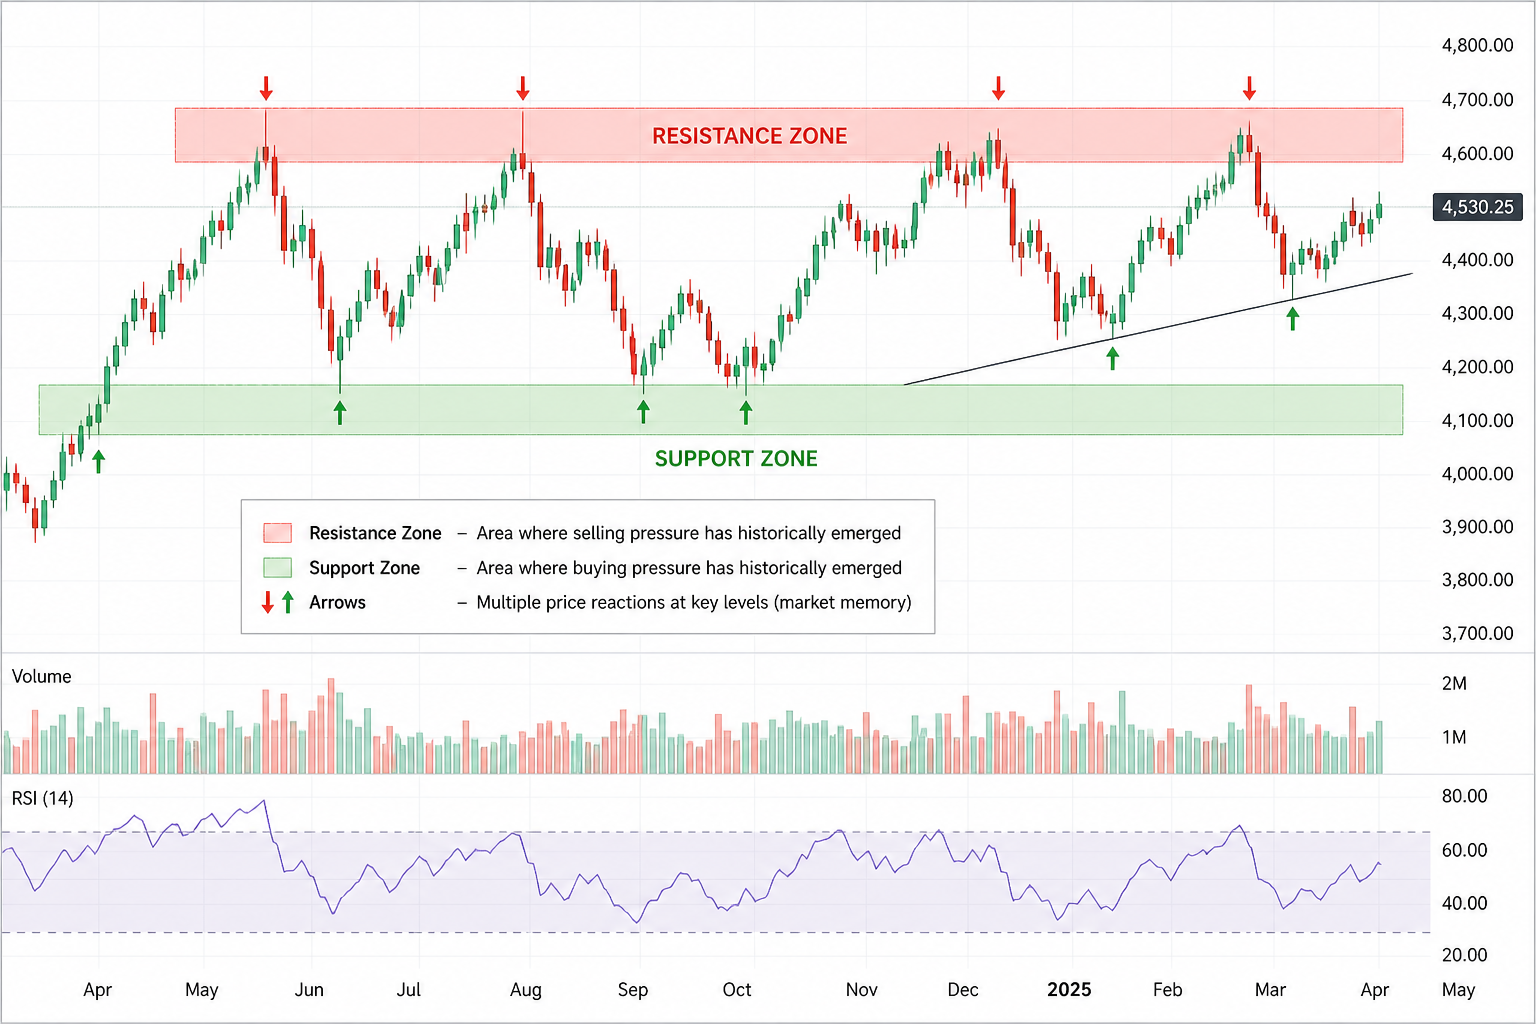
May 1, 2026
Technical Deep Dives

What Are Support and Resistance Levels? A Complete Guide to Key Technical Levels

Support and resistance levels are among the most fundamental and widely referenced concepts in technical chart analysis. They appear in every Chartrick analysis published across S&P 500 (SPX), Gold...
Read More
Chartrick

Chartrick is a research-driven platform providing educational technical chart analysis on Global Equity Markets, Commodities, and Cryptocurrencies.

Facebook-f X-twitter Instagram Dribbble
Useful Links
  • About us
  • Market Analysis
  • Get Custom Chart Analysis
  • Blogs
  • Contact Us

Disclaimer :  Chartrick provides educational technical chart analysis based on publicly available market data for informational purposes only. We do not provide investment advice, financial advisory services, or trading recommendations. Use of this platform does not create an advisory or client relationship.

Disclaimer | Terms of Use |  Privacy Policy | Legal Compliance Statement