• Home
  • About us
  • Market Analysis
  • Get Custom Chart Analysis
  • The Analyst’s Edge
  • Contact Us
CT_logo. CT_logo.
  • Home
  • About us
  • Market Analysis
  • Get Custom Chart Analysis
  • The Analyst’s Edge
  • Contact Us
Explore More

Day: May 2, 2026

RSI indicator technical chart analysis showing overbought and oversold levels on a financial chart
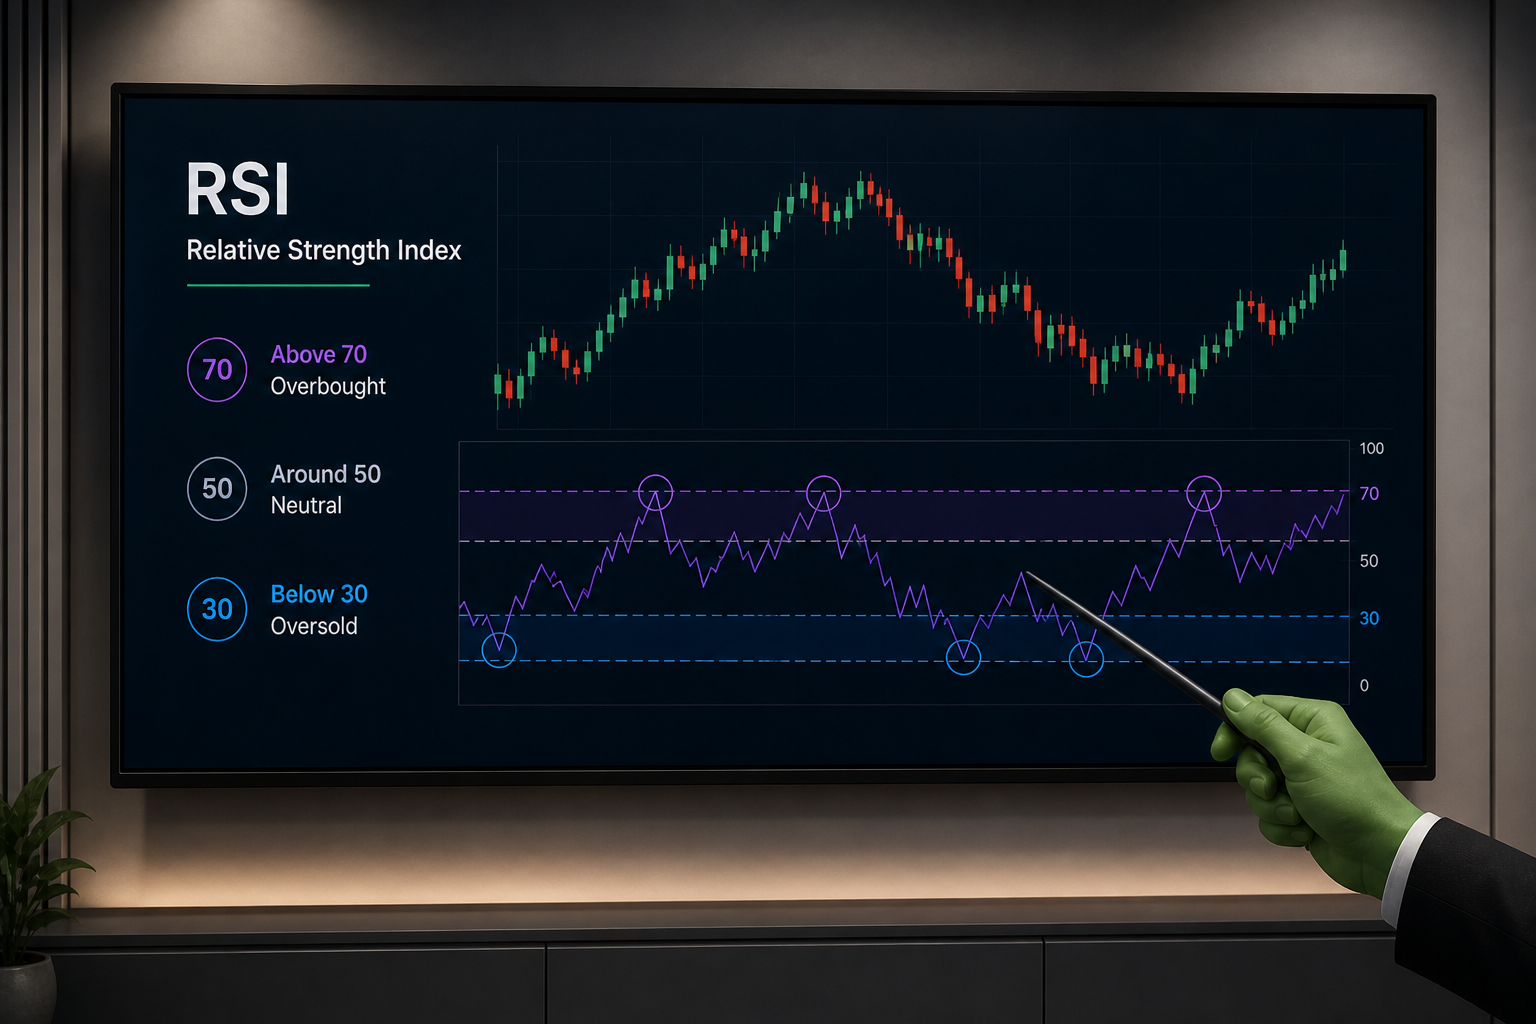
May 2, 2026
Technical Deep Dives

How to Read RSI: Understanding Momentum in Financial Charts

The Relative Strength Index – universally known as RSI – is one of the most widely referenced indicators in technical chart analysis. It appears in every market Chartrick covers,...
Read More
Chartrick

Chartrick is a research-driven platform providing educational technical chart analysis on Global Equity Markets, Commodities, and Cryptocurrencies.

Facebook-f X-twitter Instagram Dribbble
Useful Links
  • About us
  • Market Analysis
  • Get Custom Chart Analysis
  • Blogs
  • Contact Us

Disclaimer :  Chartrick provides educational technical chart analysis based on publicly available market data for informational purposes only. We do not provide investment advice, financial advisory services, or trading recommendations. Use of this platform does not create an advisory or client relationship.

Disclaimer | Terms of Use |  Privacy Policy | Legal Compliance Statement