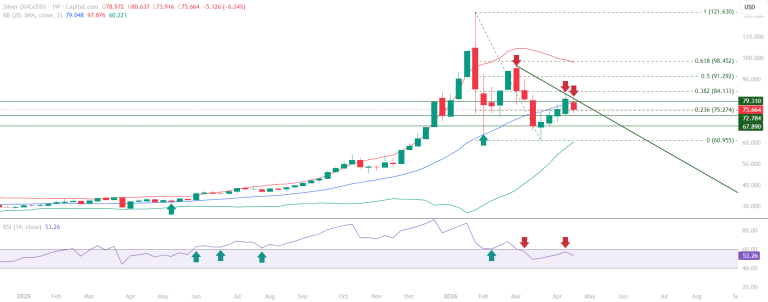
Silver Weekly Technical Analysis: Consolidation within Broader Downtrend
Silver has run into a wall of technical resistance – the RSI 60 level, the Mid Bollinger Band at 79.048, and a downward sloping trendline.

Silver has run into a wall of technical resistance – the RSI 60 level, the Mid Bollinger Band at 79.048, and a downward sloping trendline.
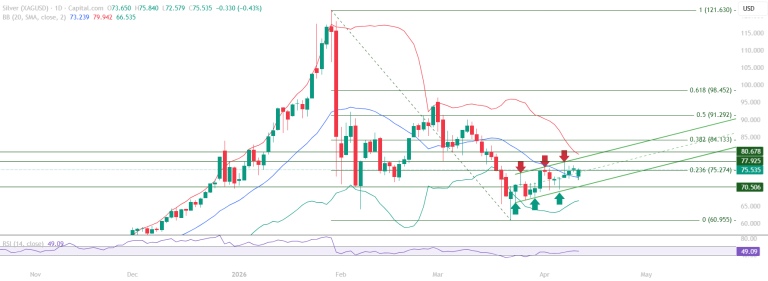
This Silver chart analysis examines the defining structural development: the 70.506 level has transitioned from a resistance zone to a support level.
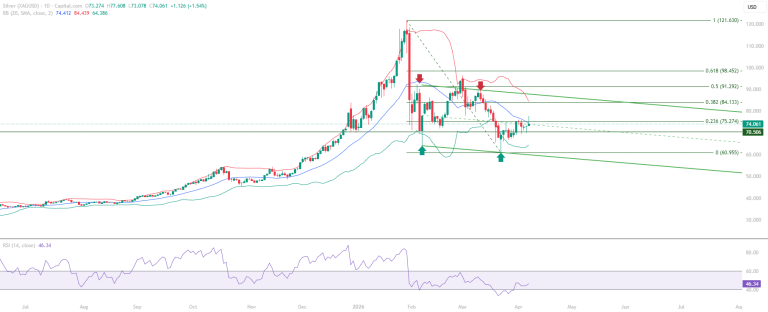
Silver educational technical chart analysis identifies a market approaching a structurally significant compressed resistance confluence.
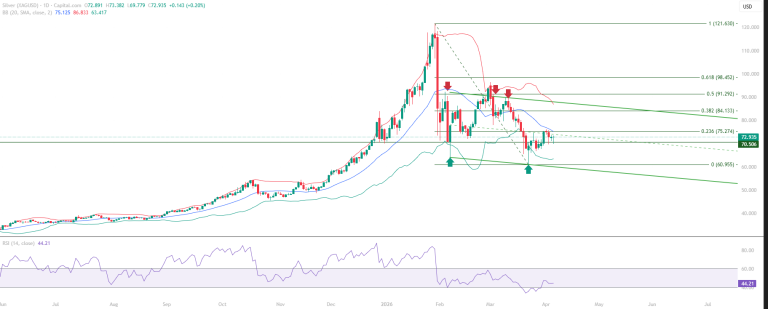
This Silver chart analysis examines the recovery from the 60.955 base: the rally to 76.107 established the initial advance.
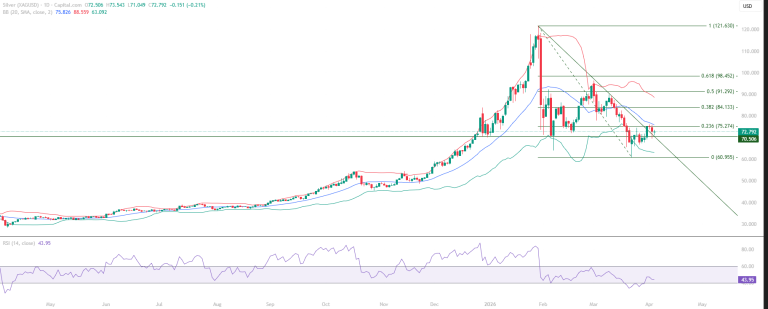
This Silver chart analysis examines the quality of each development. The 70.506 polarity change is confirmed - not implied.
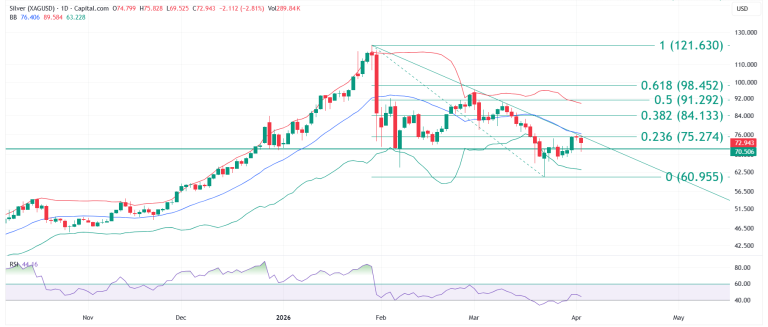
Silver analysis identifies the 70.506 resistance-to-support transition as the defining structural development of the current phase.