Silver Weekly: Technical Analysis, RSI & Key Levels
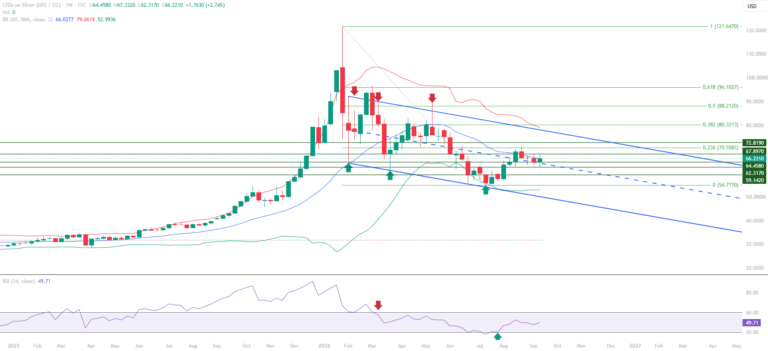
Silver today shows a bounce from the lower boundary of the downward-sloping trend channel, according to this analysis.

Silver today shows a bounce from the lower boundary of the downward-sloping trend channel, according to this analysis.
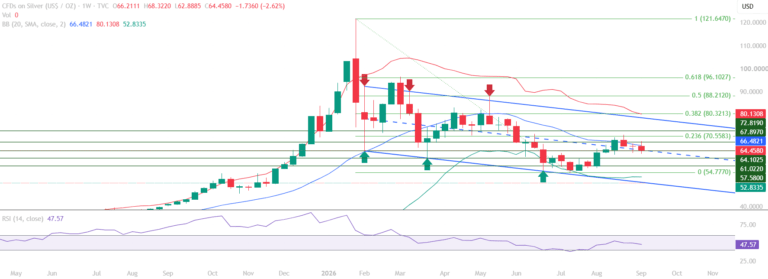
Silver weekly analysis for 14–18 September 2026 covering XAGUSD market prediction, support and resistance levels, RSI, Bollinger Bands, Fibonacci, and trend outlook.
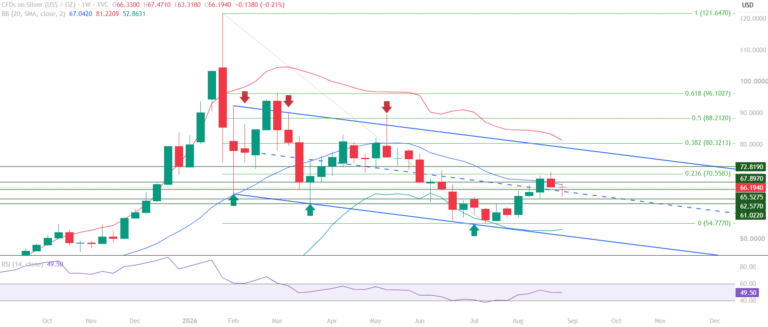
This SIlver Analysis examines a market that remains in a broader downtrend, continuing to trade within a downward-sloping trend channel.
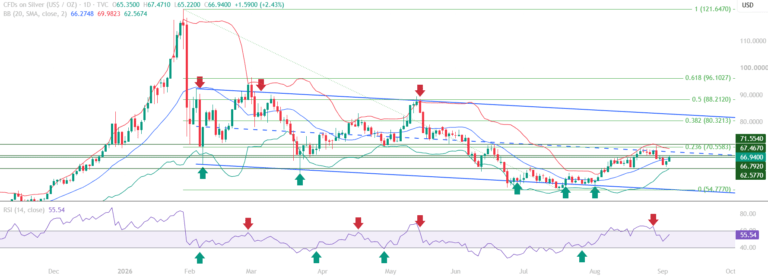
Silver Market Today, Silver remains in a broader downtrend and continues to trade within a downward-sloping trend channel.
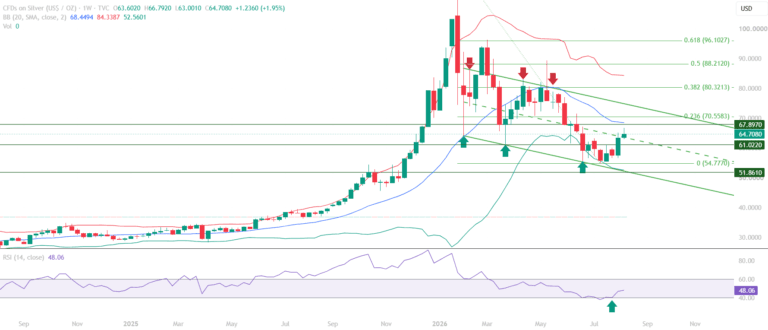
Weekly Analysis Silver (XAGUSD) | Published by Chartrick’s Team of Experienced Technical Analysts Week17 – 21 August 2026 CMP64.70 (as on 16 August 2026) OutlookTechnical Bounce within a Broader Downtrend Opening paragraph Silver enters the week of 17-21 August 2026…
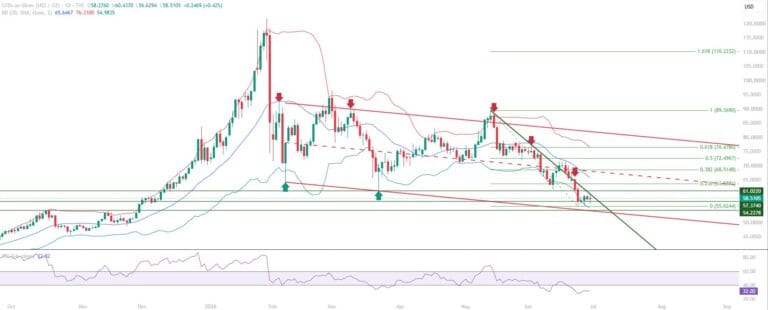
Silver is still trading below its March 2026 low. The RSI has slipped below 40, and hasn't been able to climb back above it. That's a meaningful shift in momentum.
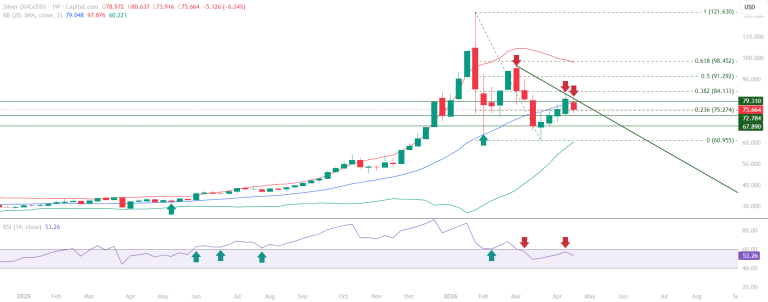
Silver has run into a wall of technical resistance – the RSI 60 level, the Mid Bollinger Band at 79.048, and a downward sloping trendline.
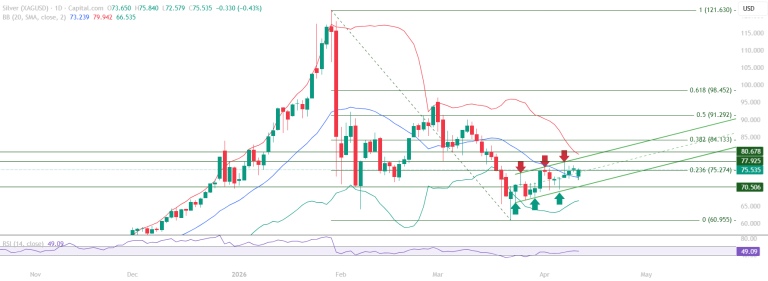
This Silver chart analysis examines the defining structural development: the 70.506 level has transitioned from a resistance zone to a support level.
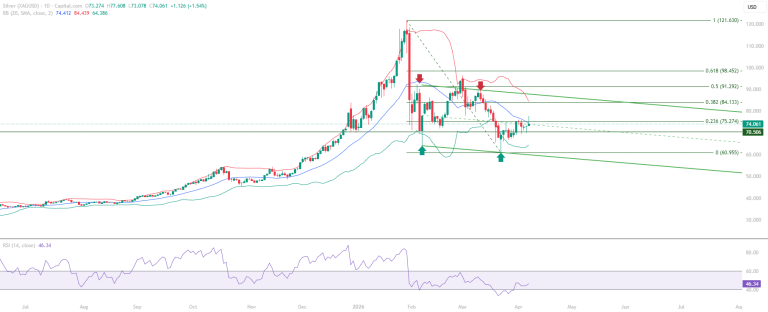
Silver educational technical chart analysis identifies a market approaching a structurally significant compressed resistance confluence.
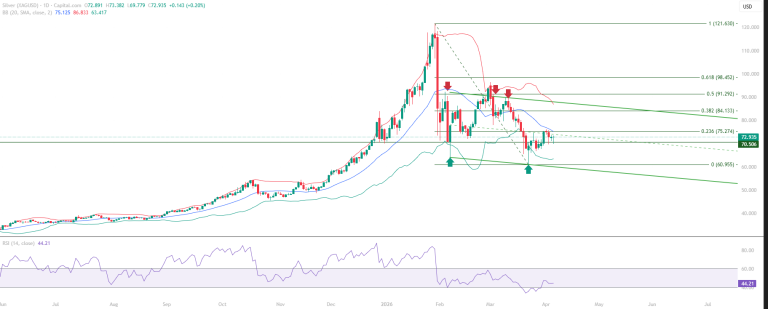
This Silver chart analysis examines the recovery from the 60.955 base: the rally to 76.107 established the initial advance.