Search for:
Home
About us
Market Analysis
Get Custom Chart Analysis
The Analyst’s Edge
Contact Us
Home
About us
Market Analysis
Get Custom Chart Analysis
The Analyst’s Edge
Contact Us
Explore More
Market Analysis
All
Equity Analysis
Crypto Analysis
Commodities
Silver Analysis
Gold Analysis
Crude Oil Analysis
From
To
Apply
Reset
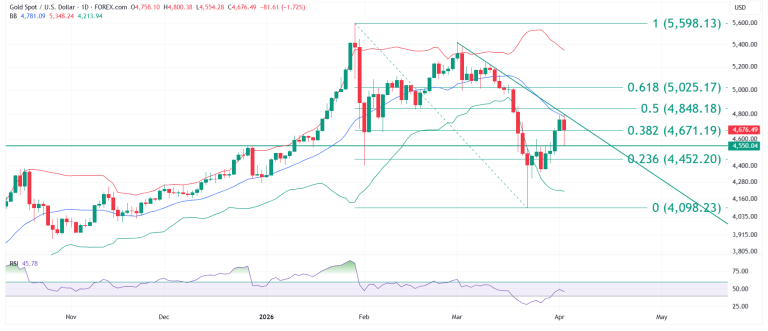
April 6, 2026
Gold
Gold (XAUUSD): Recovery Rally Approaches 4,800 Trendline Confluence
Read More
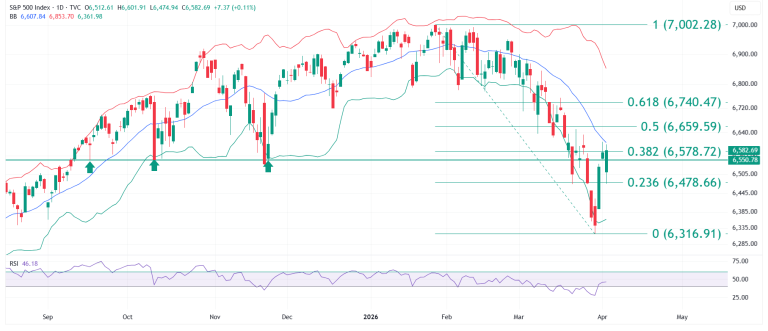
April 6, 2026
S&P 500
S&P 500: Fibonacci Bounce Tests Mid Bollinger Band Resistance
Read More
Previous
Next