
Weekly Analysis
Bitcoin (BTC) | Published by Chartrick’s Team of Experienced Technical Analysts
Opening paragraph
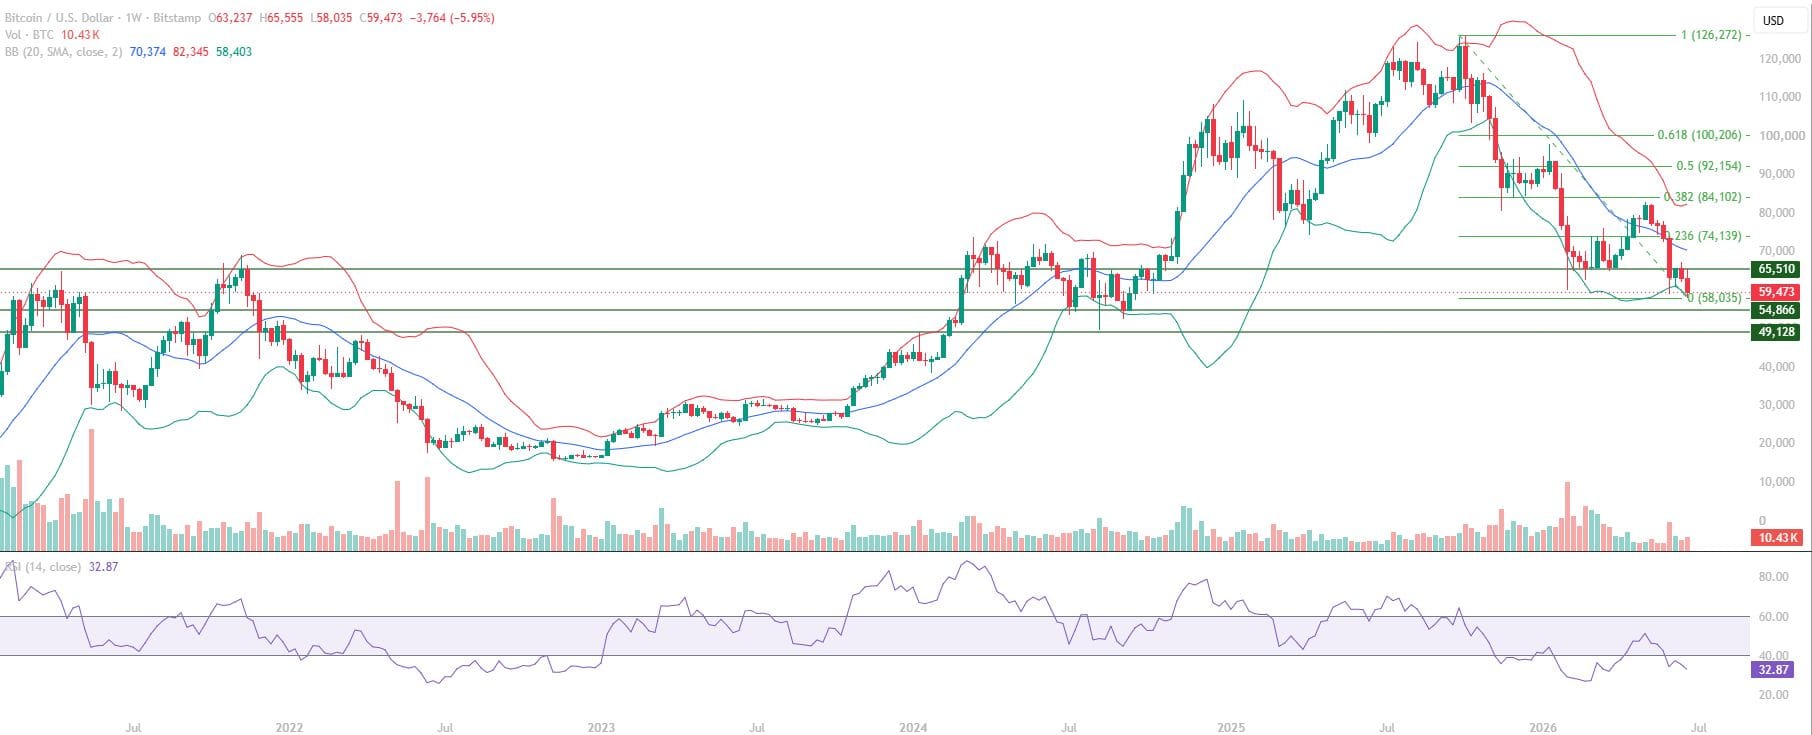
Bitcoin’s weekly chart just printed another lower low, and the structure keeps telling the same story.
All content on this page is educational technical chart analysis provided for informational purposes only. It does not constitute investment advice or any recommendation to buy, sell, or hold any financial instrument.
What Does the Current Bitcoin Chart Structure Show?
Price is trading below the February 2026 low this week, which reinforces the broader downtrend that’s been in place for some time. Price is also sitting below the Mid Bollinger Band of 70,374, which is acting as the primary resistance zone right now.
- Price trading below the February 2026 low – broader downtrend reinforced
- Price sitting below the Mid Bollinger Band of 70,374 – acting as primary resistance
The Mid Bollinger Band as Primary Resistance
The Mid Bollinger Band at 70,374 is the key structural ceiling in this Bitcoin chart right now. With price contained below it, this level lines up with the Key Resistance zone below and remains the first major hurdle any recovery attempt would need to clear.
How Are the Technical Indicators Reading?
RSI has slipped below the 40 level, confirming a bearish range shift in momentum. A sustained move back above RSI 40 would be the first real sign of improving momentum.
- RSI below 40 – bearish momentum range shift confirmed
- A sustained reclaim of RSI 40 would be the first real sign of improving momentum
Key Technical Levels for Bitcoin (BTC)
The levels below outline the immediate, key, and major resistance and support zones currently in play for Bitcoin (BTC).
Resistance Levels
| Resistance Type | Price Level | Notes |
|---|---|---|
| Immediate Resistance | 65,510 | Immediate resistance zone |
| Key Resistance | 70,374 | Mid Bollinger Band |
| Major Resistance | 74,139 | Fibonacci 0.236 |
Support Levels
| Support Type | Price Level | Notes |
|---|---|---|
| Immediate Support | 58,035 | Immediate support zone |
| Key Support | 54,866 | Key support |
| Major Support | 49,128 | Major support |
Summary: Bitcoin Technical Outlook
Bitcoin’s weekly structure remains under pressure, with price below the February 2026 low and RSI confirming a bearish momentum range shift. The Mid Bollinger Band at 70,374 continues to act as the primary resistance overhead. The 54,866 to 65,510 zone is the one to watch most closely this week.
- Broader downtrend reinforced by a fresh lower low on the weekly chart
- RSI below 40 – bearish range shift, with a reclaim of 40 as the first improvement signal
- 54,866 to 65,510 is the key zone in focus this week
Important Disclaimer
All content on Chartrick, including charts, analysis reports, articles, and educational materials, is provided for general informational and educational purposes only. Nothing on this platform constitutes investment advice, financial advice, trading advice, or any recommendation to buy, sell, or hold any financial instrument. Financial markets carry risk, and past chart analysis does not guarantee future performance. All analysis is based on publicly available market data and is subject to change at any time. While every effort is made to ensure accuracy, Chartrick does not accept liability for any loss, damage, or financial outcome arising directly or indirectly from use of or reliance on this content, including any errors or omissions in the analysis. Users are solely responsible for their own investment and trading decisions and should exercise their own independent judgment.





