
Daily Analysis
Gold (XAUUSD) | Published by Chartrick’s Team of Experienced Technical Analysts
Opening paragraph
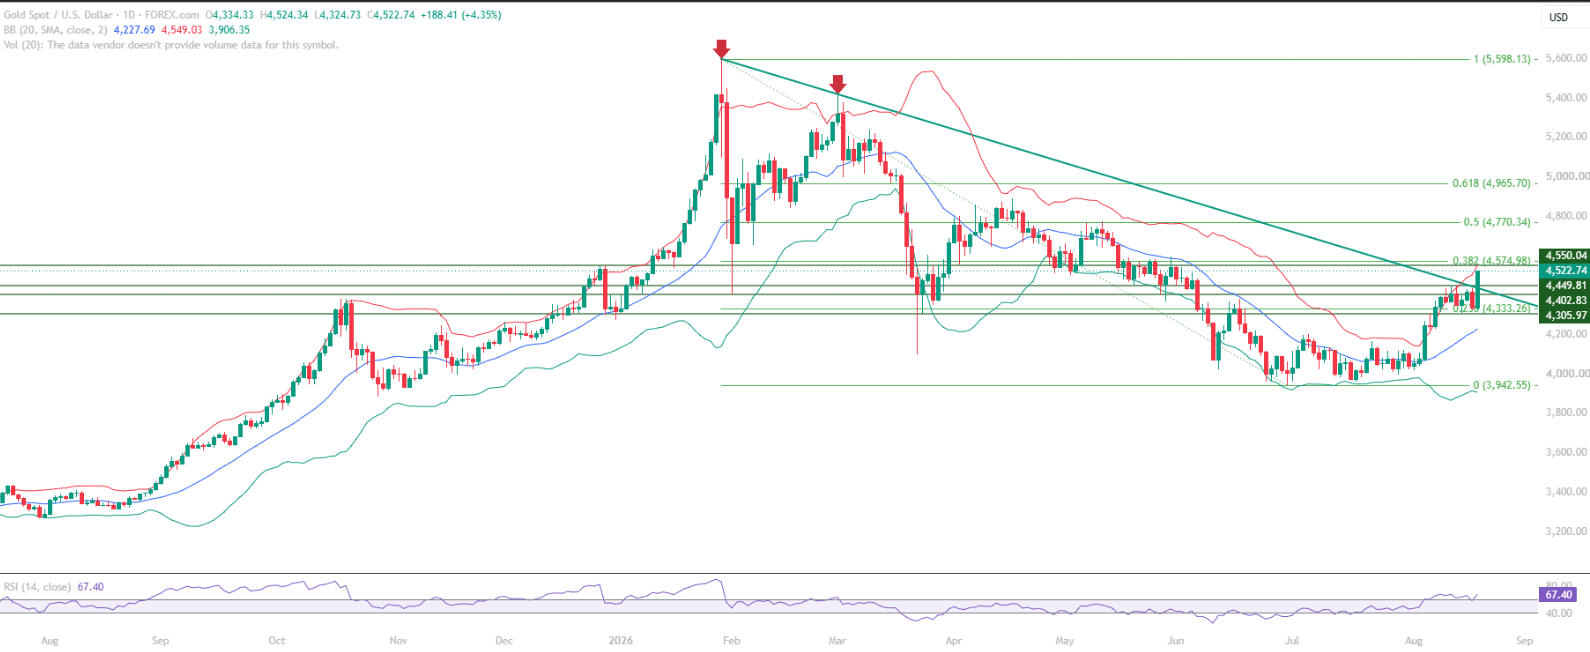
Gold (XAUUSD) educational technical chart analysis for 20 August 2026 examines a market pressing into a critical resistance confluence after months inside a broader downtrend. Price closed at 4,522.74, holding above the descending trendline that has capped every rally since the downtrend began, while RSI is sustaining above the 60 level, confirming improving short-term momentum heading into the session.
This Gold chart analysis identifies the break above the descending trendline as the foundational context for the current structure. A solid base formed at the 3,950 to 4,000 zone, and the subsequent recovery has carried price back above the Mid Bollinger Band, an early technical sign of strength from the recent lows. The session ahead is likely to center on the 4,550 to 4,575 zone, where the market is now searching for direction between the immediate resistance and the broader downtrend it has yet to fully escape.
All content on this page is educational technical chart analysis provided for informational purposes only. It does not constitute investment advice or any recommendation to buy, sell, or hold any financial instrument.
What Does the Current Gold Chart Structure Show?
The daily Gold (XAUUSD) chart reflects a technical bounce developing from the 3,950 to 4,000 base, following a broader downtrend that has been in place since the prior cycle’s high. Price is currently trading above the downward-sloping trendline formed during this corrective move, and that trendline break stands as the key structural signal separating the current recovery attempt from the downtrend that preceded it.
Momentum readings support this cautiously constructive read. RSI has recovered from support near the 40 level and is now sustaining above 60, a threshold that has historically marked improving momentum within this downtrend. Price is also trading well above the Mid Bollinger Band at 4,227.69, reinforcing that the near-term structure has shifted even as the broader trend remains unconfirmed as a reversal.
- Technical bounce developing from the 3,950 to 4,000 base within the broader downtrend
- Price closed above the downward-sloping trendline, an early sign of structural strength
- RSI is sustaining above the 60 level, confirming improving short-term momentum
- Mid Bollinger Band at 4,227.69 sits well below current price, now a potential support zone
- Price is approaching the 4,550 to 4,575 resistance confluence, the next key decision zone
The Trendline Break Signal
The break above the descending trendline that formed at the start of this downtrend remains the most significant structural signal in this Gold chart analysis. A move back above a trendline that has held for months is a technical pattern often associated with early demand returning to a market, rather than a temporary pause in an otherwise intact downtrend. Markets do not turn on price alone, and the combination of the trendline break with RSI reclaiming the 60 level is worth noting in any educational technical chart analysis of this period. The recovery that has held since is consistent with an early technical bounce, though it has not yet been confirmed as a broader trend reversal.
How Are the Technical Indicators Reading?
RSI analysis in this Gold educational technical chart analysis shows the momentum indicator sustaining above the 60 level after finding support near 40 on the prior pullback, a structural threshold that has separated genuine momentum shifts from failed bounce attempts during this downtrend. A sustained move back below 60 would be the first technical indication that the current bounce is losing momentum, and the market will be watching this closely through the session.
Bollinger Band positioning adds further context. The Mid Bollinger Band at 4,227.69 now sits well below current price, marking a level that may act as major dynamic support should the recovery continue. Fibonacci retracement levels drawn from the broader downtrend place the 0.382 level at 4,574.98, directly inside the current resistance confluence, with the 0.5 level at 4,770.34 and the 0.618 level at 4,965.70 as the next reference points should this zone eventually give way.
- RSI sustaining above 60, confirming improving short-term momentum heading into the session
- Mid Bollinger Band at 4,227.69 has shifted from resistance to a potential support zone
- Fibonacci 0.382 at 4,574.98 sits inside the current key resistance confluence
- The trendline break from the start of the downtrend continues to support the technical bounce read
Key Technical Levels for Gold (XAUUSD)
The following levels are identified in this Gold educational technical chart analysis. All levels are derived from expert chart analysis using publicly available market data.
Resistance Levels
| Resistance Type | Price Level | Notes |
|---|---|---|
| Immediate Resistance | 4,550.04 | Upper edge of the current reaction zone |
| Key Resistance | 4,574.98 | Fibonacci 0.382 retracement |
| Major Resistance | 4,770.34 | Fibonacci 0.50 retracement |
Support Levels
| Support Type | Price Level | Notes |
|---|---|---|
| Immediate Support | 4,449.81 | Immediate support within the current reaction zone |
| Key Support | 4,402.83 | Key support below the immediate zone |
| Major Support | 4,305.97 | Major support, lower boundary of the recovery structure |
Summary: Gold Technical Outlook
This Gold (XAUUSD) educational technical chart analysis for 20 August 2026 identifies a market in technical bounce, with a confirmed break above the descending trendline offset by a broader downtrend that has not yet been reversed. RSI sustaining above 60, price trading well above the Mid Bollinger Band, and the approach toward the 4,550 to 4,575 resistance confluence together describe a structure at a genuine decision point.
The 4,550 to 4,575 zone, where the Fibonacci 0.382 level and the upper Bollinger Band converge, is the level that defines the near-term resolution for this recovery. A sustained close above it, together with RSI holding above 60, would strengthen the case for a broader trend reversal. Conversely, rejection from this zone back toward 4,449.81 and 4,402.83 would suggest the broader downtrend is reasserting itself rather than giving way to a genuine reversal.
- Gold has broken above its descending trendline while remaining within a broader downtrend
- RSI is sustaining above 60, confirming improving short-term momentum
- Price is trading well above the Mid Bollinger Band at 4,227.69
- The 4,550 to 4,575 resistance confluence is the key zone to watch this session
- A sustained close above 4,574.98 with RSI holding above 60 would strengthen the reversal case
See our previous Gold analysis [LINK: previous Gold post] for the structural context behind this recovery, and check our broader precious metals coverage [LINK: precious metals market analysis] for how Silver is behaving alongside Gold.
Want Expert Analysis on a Specific Asset?
Request a custom weekly chart interpretation of Equities, Cryptos, Commodities & Indices from Chartrick’s team of experienced technical analysts. Delivered to your inbox within 2 working days.
Important Disclaimer
All content on Chartrick, including charts, analysis reports, articles, and educational materials, is provided for general informational and educational purposes only. Nothing on this platform constitutes investment advice, financial advice, trading advice, or any recommendation to buy, sell, or hold any financial instrument. Financial markets carry risk, and past chart analysis does not guarantee future performance. All analysis is based on publicly available market data and is subject to change at any time. While every effort is made to ensure accuracy, Chartrick does not accept liability for any loss, damage, or financial outcome arising directly or indirectly from use of or reliance on this content, including any errors or omissions in the analysis. Users are solely responsible for their own investment and trading decisions and should exercise their own independent judgment.





