
Weekly Analysis
Key Insight
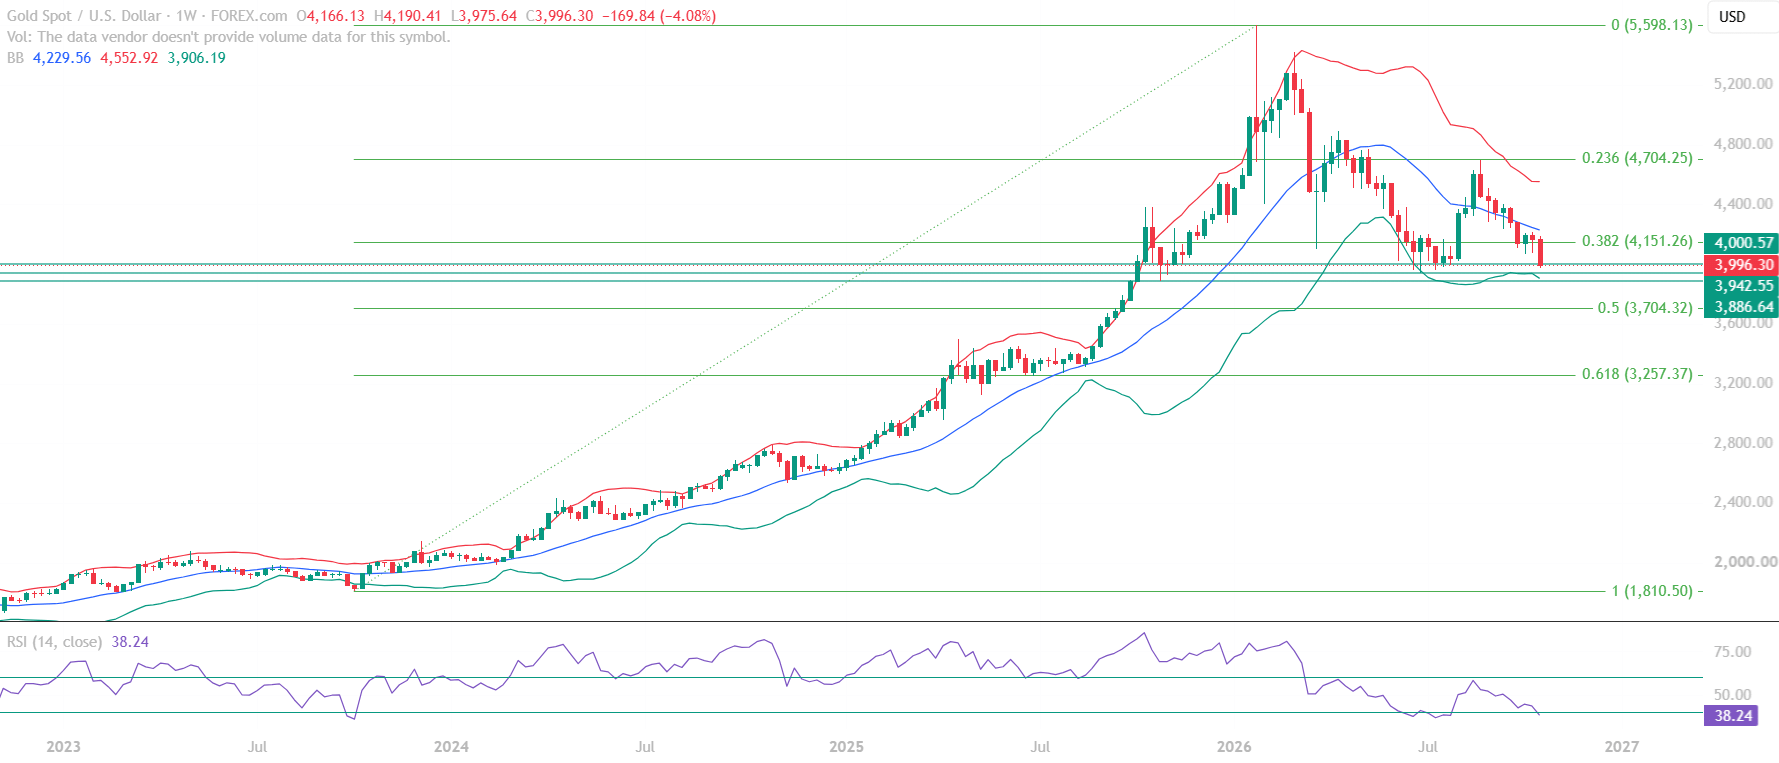
Gold price prediction today: examines a market that closed the previous week at 3,996.30, below the Fibonacci 0.382 retracement level at 4,151.26 and below the middle Bollinger Band at 4,229.56. With RSI at 38.24, beneath the key 40 threshold, the weekly structure reflects weakening momentum inside a corrective phase.
Anyone searching for a gold price prediction should note that this educational technical chart analysis does not forecast a single outcome. It maps the market structure, the technical indicators and the support and resistance levels that will shape price reactions. The broader backdrop is the rally that began around October 2023, which provides the context for the present correction. The recent recovery from the 3,950 to 4,000 region has come under renewed pressure, and that potential base is now being tested, which makes the 3,886.64 support level an important area to watch.
All content on this page is educational technical chart analysis provided for informational purposes only. It does not constitute investment advice or any recommendation to buy, sell, or hold any financial instrument.
Gold Price Prediction: What Does the Current XAUUSD Chart Structure Show?
The weekly Gold (XAUUSD) candlestick chart shows a corrective phase with bearish short-term momentum. The latest weekly candle opened at 4,166.13, reached a high of 4,190.41 and a low of 3,975.64, and closed at 3,996.30, a decline of 4.08% on the week. Price therefore traded above the Fibonacci 0.382 level at 4,151.26 during the week but failed to sustain above it, and the weekly close sits below both that level and the middle Bollinger Band at 4,229.56.
The market is now testing whether the recent base can withstand the selling pressure. A sustained break below key support would strengthen the case for an extended correction, while a recovery above nearby resistance would suggest an improving price structure. The weekly low of 3,975.64 held above the immediate support at 3,942.55, which means that support level, along with the key support at 3,886.64, still sits ahead of price rather than behind it.
- Weekly close at 3,996.30 – corrective phase with bearish short-term momentum
- Failure to sustain above the Fibonacci 0.382 level at 4,151.26 – key resistance reference
- Close below the middle Bollinger Band at 4,229.56 – continued price weakness
- Potential base around 3,950 to 4,000 – currently under test
- Rally from October 2023 – broader context for the present correction
The Key Structural Shift: Fibonacci 0.382 and the Middle Bollinger Band
The most important structural signal in this Gold chart analysis is that price has retreated below the Fibonacci 0.382 resistance at 4,151.26 and below the middle Bollinger Band, while RSI has fallen below 40. Each of these readings on its own is a reference point, but together they describe a market where recovery attempts have not yet held. Fibonacci retracement levels provide reference zones for evaluating price reactions during the current correction, with the 0.382 level remaining the key resistance reference. The interaction with the 3,886.64 support level will be important in assessing whether the correction extends further.
How Are the Gold (XAUUSD) Technical Indicators Reading?
RSI analysis in this Gold educational technical chart analysis shows the momentum indicator at 38.24, having slipped below the key 40 threshold after previously finding support around this level. This reflects weak momentum and continued bearish pressure. A sustained recovery above 40 would provide an initial indication of improving momentum, although an RSI recovery alone would not confirm a trend reversal. Price action around key resistance levels should also be monitored.
The Bollinger Bands and Fibonacci retracement levels add the structural reference points. Gold is trading below the middle Bollinger Band at 4,229.56, an important reference for assessing whether the current corrective pressure persists or a recovery regains momentum. On the Fibonacci retracement, the 0 level sits at 5,598.13, with the 0.236 level at 4,704.25, the 0.382 level at 4,151.26, the 0.5 level at 3,704.32 and the 0.618 level at 3,257.37.
- RSI at 38.24 – below the key 40 threshold, reflecting weakening momentum
- RSI recovery above 40 – would be an initial sign of improving momentum, not a confirmed reversal
- Middle Bollinger Band at 4,229.56 – positioned above price as an important reference
- Fibonacci 0.5 at 3,704.32 – marks a potential deeper support zone
Key Technical Levels for Gold (XAUUSD)
The following levels are identified in this Gold educational technical chart analysis. All levels are derived from expert chart analysis using publicly available market data. The zone between 3,886.64 and 4,151.26 is the immediate reaction zone in which price is currently trading.
Resistance Levels
| Resistance Type | Price Level | Notes |
|---|---|---|
| Immediate Resistance | 4,017.48 | Nearest overhead level, above the 3,996.30 close |
| Key Resistance | 4,151.26 | Fibonacci 0.382 retracement – key resistance reference |
| Major Resistance | 4,229.56 | Middle Bollinger Band – important overhead reference |
Support Levels
| Support Type | Price Level | Notes |
|---|---|---|
| Immediate Support | 3,942.55 | Nearest support below the close |
| Key Support | 3,886.64 | Important downside reference |
| Major Support | 3,704.32 | Fibonacci 0.5 retracement – potential deeper support zone |
Summary: Gold (XAUUSD) Technical Outlook
This Gold (XAUUSD) educational technical chart analysis for 26 October to 30 October 2026 identifies a corrective structure with weakening momentum. Price failed to sustain above the Fibonacci 0.382 level at 4,151.26, closed below the middle Bollinger Band at 4,229.56, and RSI at 38.24 sits below the key 40 threshold. The potential base around 3,950 to 4,000 is under test, and the 3,886.64 support level is the important downside reference.
The next directional development will depend on price behaviour around the 3,886.64 support level and the resistance zone between 4,017.48 and 4,229.56. A sustained RSI recovery above 40, accompanied by a decisive move above the middle Bollinger Band, would strengthen the case for a recovery. Until then, the corrective structure remains vulnerable to further weakness. External factors such as geopolitical developments and safe-haven demand, US Dollar strength or weakness, changes in interest-rate expectations and central-bank policy, and shifts in global investment and physical gold demand can also influence price reactions around these levels.
- Corrective phase following the rally that began around October 2023
- Failure to sustain above Fibonacci 0.382 at 4,151.26 keeps this level as key resistance
- RSI at 38.24 below 40 signals weakening momentum
- Potential base around 3,950 to 4,000 is under test, with 3,886.64 as key support
- Recovery above RSI 40 and the middle Bollinger Band at 4,229.56 would be the first evidence of stabilisation
Want Expert Analysis Under Your Own Brand?
Get White-Labeled Reports of Equities, Cryptos, Commodities & Indices from Chartrick’s team of experienced technical analysts. Delivered to your inbox.
Important Disclaimer
All content on Chartrick, including charts, analysis reports, articles, and educational materials, is provided for general informational and educational purposes only. Nothing on this platform constitutes investment advice, financial advice, trading advice, or any recommendation to buy, sell, or hold any financial instrument. Financial markets carry risk, and past chart analysis does not guarantee future performance. All analysis is based on publicly available market data and is subject to change at any time. While every effort is made to ensure accuracy, Chartrick does not accept liability for any loss, damage, or financial outcome arising directly or indirectly from use of or reliance on this content, including any errors or omissions in the analysis. Users are solely responsible for their own investment and trading decisions and should exercise their own independent judgment.