Silver (XAGUSD) | Published by Chartrick’s Team of Experienced Technical Analysts
Weekly Analysis
April 28 – May 2, 2026
75.664 (as on 24 Apr 2026)
Consolidation within Broader Downtrend – Triple Confluence Rejection
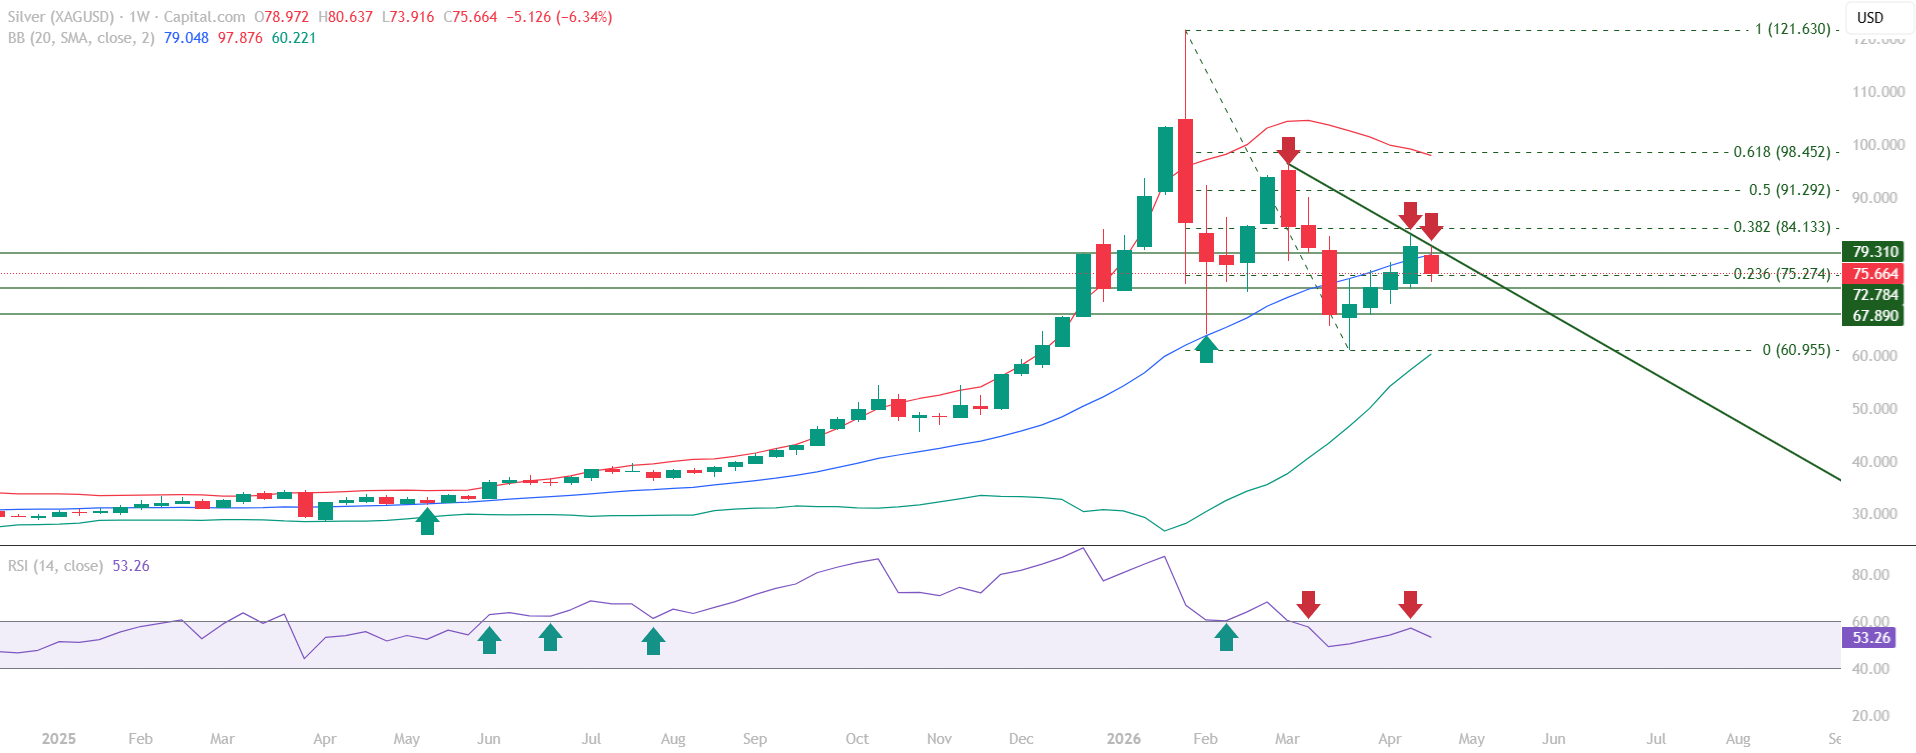
Silver (XAGUSD) weekly educational technical chart analysis for the week of April 28 – May 2, 2026 identifies a market where the bounce phase from lower levels has run into a wall of triple technical resistance. The RSI 60 level, the Mid Bollinger Band at 79.048, and the downward sloping trendline are all converging at the same zone, creating a confluence rejection that has kept the recovery attempt contained within the broader corrective structure.
This Silver chart analysis examines what the current chart structure reveals: price recovered from lows and closed above the Fibonacci 0.236 level at 75.274, confirming buying interest from lower levels. However, the rally stalled at the 79.048 Mid Bollinger Band, a level that has structurally transitioned from support to resistance following the prior breakdown. The RSI simultaneously failed to reclaim the 60 level, reinforcing the rejection signal. The downward sloping trendline sits directly overhead, completing the triple confluence of resistance that defines this week’s structural picture.
All content on this page is educational technical chart analysis provided for informational purposes only. It does not constitute investment advice or any recommendation to buy, sell, or hold any financial instrument.
What Is the Triple Confluence Resistance Zone?
In this Silver educational technical chart analysis, the convergence of three independent technical signals at the same price zone is the defining structural development for the week. The Mid Bollinger Band at 79.048 provides the first reference – a level that held as support during the prior advance but transitioned to resistance after the structural breakdown, a polarity change. The downward sloping trendline, formed during the broader corrective phase, adds a second layer of overhead resistance at the same zone.
The third element is RSI behaviour: the momentum indicator failed to reclaim the 60 level precisely as price approached the 79.048 zone. A RSI rejection at 60 occurring simultaneously with a price rejection from the Mid Bollinger Band and trendline is a triple technical alignment – three independent signals pointing to the same structural conclusion. This is the primary resistance zone this Silver chart analysis identifies for the week ahead.
- Mid Bollinger Band at 79.048 – transitioned from support to resistance after breakdown
- Downward sloping trendline – overhead resistance aligning at the same zone
- RSI failed to reclaim the 60 level – momentum rejection at the threshold
- Triple confluence: all three signals at the same zone reinforces structural resistance
- Fibonacci 0.236 at 75.274 – reclaimed as support, price closed above it from below
What Does the Broader Downtrend Structure Show?
This Silver educational technical chart analysis places the current bounce phase within its broader structural context. The corrective phase from prior highs established the downward sloping trendline as the defining overhead boundary. The recovery from the 60.955 base has been a bounce phase within this broader downtrend – a pattern where price recovers toward key resistance levels but encounters structural resistance that keeps the corrective structure intact.
The Fibonacci retracement framework maps the structure clearly. The 0.236 level at 75.274 has been reclaimed from below – a constructive development that confirms buying interest at lower levels. However, the distance between the current price at 75.664 and the next Fibonacci level at 84.133 (the 0.382 retracement) is significant, and the triple confluence resistance at 79.048 occupies the zone between these two references as the near-term structural ceiling.
- Broader downtrend structure intact – bounce phase within corrective framework
- Fibonacci 0.236 at 75.274 reclaimed – buying interest confirmed at lower levels
- Triple confluence at 79.048 defines the near-term ceiling for the bounce phase
- Fibonacci 0.382 at 84.133 is the next structural level above the resistance zone
- 70.506 – key structural support below, former resistance now holding as support
Bollinger Band Structural Context
The Mid Bollinger Band at 79.048 carries additional structural significance because of its polarity change. A level that previously acted as support during the advance now acts as resistance following the breakdown. This means the 79.048 zone carries memory from both directions. Price interacting with a polarity-changed Bollinger Band level, with the downward sloping trendline aligned at the same zone and RSI simultaneously capped at 60, creates a structurally meaningful rejection signal within the broader corrective framework.
Key Technical Levels for Silver (XAGUSD)
The following levels are identified in this Silver educational technical chart analysis. All levels are derived from Vipul’s expert chart analysis using publicly available market data.
Resistance Levels
| Resistance Type | Price Level | Notes |
|---|---|---|
| Triple Confluence Resistance | 79.048 | Mid Bollinger Band + downward sloping trendline + RSI 60 – primary resistance zone for the week |
| Strong Resistance | 84.133 | Fibonacci 0.382 – next significant level above the confluence zone |
| Key Resistance | 91.292 | Fibonacci 0.50 retracement |
| Major Resistance | 98.452 | Fibonacci 0.618 retracement |
Support Levels
| Support Type | Price Level | Notes |
|---|---|---|
| Immediate Support | 75.274 | Fibonacci 0.236 – reclaimed as support, price closed above this level |
| Key Support | 70.506 | Former resistance, confirmed structural support – multiple retests held |
| Major Support | 60.955 | Fibonacci 0 – corrective phase base, major structural floor |
Summary: Silver Technical Outlook for the Week
This Silver (XAGUSD) weekly educational technical chart analysis for the week of April 28 – May 2, 2026 identifies a market where the bounce phase from lower levels has encountered a structurally significant triple confluence rejection. The RSI 60 level, Mid Bollinger Band at 79.048, and downward sloping trendline together define a resistance zone that has capped the recovery attempt and maintained the broader corrective structure.
The constructive element within this structure is the reclaim of the Fibonacci 0.236 at 75.274 as support – price closing above this level confirms that buying interest is present at lower structural levels. The 70.506 key support below provides a secondary floor. For the week ahead, the interaction between price and the 79.048 triple confluence zone remains the primary technical event to observe – whether the resistance holds or is overcome will define the next phase of Silver’s chart structure.
- Triple confluence rejection at 79.048 – RSI 60, Mid Bollinger Band, downward trendline
- Mid Bollinger Band polarity change confirmed – former support now acting as resistance
- Fibonacci 0.236 at 75.274 reclaimed as support – buying interest at lower levels confirmed
- 70.506 structural support below remains a key floor for the consolidation structure
- Broader downtrend intact – bounce phase contained within the corrective framework
Want Expert Analysis on a Specific Asset?
Request a custom weekly chart interpretation of Equities, Cryptos, Commodities & Indices from Chartrick’s team of experienced technical analysts. Delivered to your inbox within 2 working days.
Decoding the Language of Charts.
Important Disclaimer
All content on Chartrick, including charts, analysis reports, articles, and educational materials, is provided for general informational and educational purposes only. Nothing on this platform constitutes investment advice, financial advice, trading advice, or any recommendation to buy, sell, or hold any financial instrument. Financial markets carry risk, and past chart analysis does not guarantee future performance. All analysis is based on publicly available market data and is subject to change at any time. While every effort is made to ensure accuracy, Chartrick does not accept liability for any loss, damage, or financial outcome arising directly or indirectly from use of or reliance on this content, including any errors or omissions in the analysis. Users are solely responsible for their own investment and trading decisions and should exercise their own independent judgment.