
Daily Analysis
Gold (XAUUSD) | Published by Chartrick’s Team of Experienced Technical Analysts
Opening paragraph
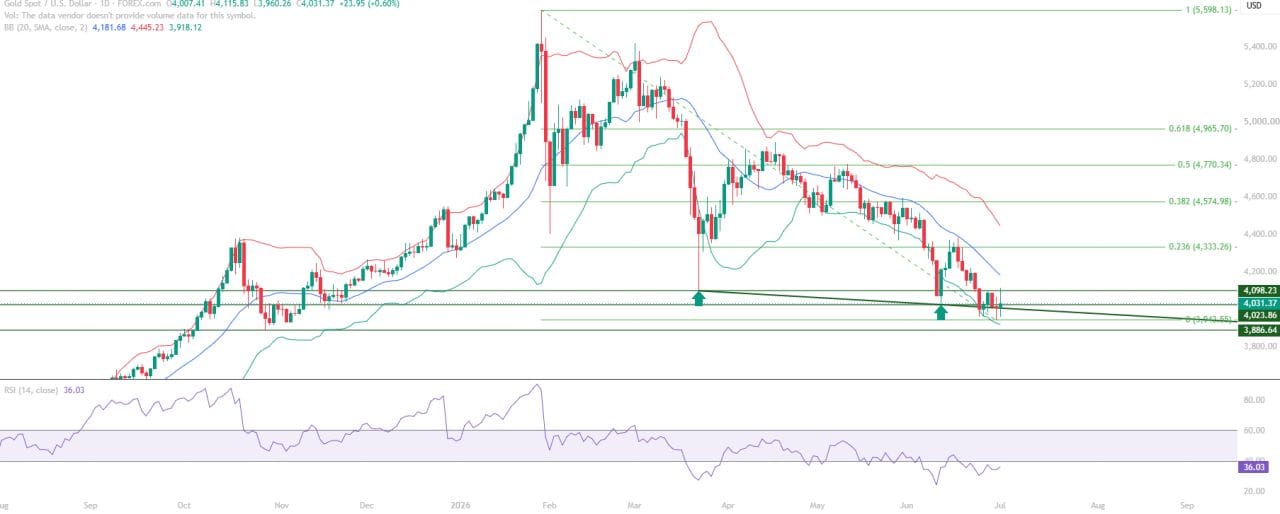
Price is trading below the March 2026 low, and the pattern of lower lows tells a clear story: sellers are still in control.
The one thing holding the line is a trendline formed by the last two swing lows – it’s been tested more than once and held each time, keeping the broader downtrend from accelerating further.
All content on this page is educational technical chart analysis provided for informational purposes only. It does not constitute investment advice or any recommendation to buy, sell, or hold any financial instrument.
What Does the Current Gold Chart Structure Show?
Price trading below the March 2026 low, with a continuing pattern of lower lows, keeps the broader structure firmly in sellers’ favour. Each rally attempt so far has failed to change that picture, and the downtrend remains the dominant read on the chart.
The one structural feature offering resistance to further declines is a trendline formed by the last two swing lows. It has absorbed multiple tests without breaking, making it the level to watch for any near-term shift in structure.
- Price trading below the March 2026 low – lower-low pattern intact
- Sellers remain in control of the broader structure
- Trendline from the last two swing lows has been tested more than once and held each time
- This trendline is currently the one structural feature holding the line against further downside
The Trendline as the Key Structural Signal
The swing-low trendline is the most significant structural feature in this Gold chart analysis. Its repeated defense suggests buyers are stepping in at a consistent structural point even as the broader trend remains down. A break of this trendline would remove the last technical support keeping the downtrend from accelerating, while continued defense keeps the door open for a technical bounce.
How Are the Technical Indicators Reading?
RSI has slipped below 40 and hasn’t been able to reclaim it – that’s the momentum picture right now, and it lines up with the broader structure on price.
This bearish momentum reading reinforces that sellers continue to dictate the pace of the move, consistent with the lower-low pattern already visible in price. The trendline remains the key structural counterbalance to this bearish momentum picture.
- RSI below 40, unreclaimed – the current momentum picture
- Momentum reading lines up with the broader downtrend structure
- Trendline defense continues to counterbalance the bearish momentum read
Key Technical Levels for Gold (XAUUSD)
The levels below outline the immediate, key, and major resistance and support zones currently in play for Gold (XAUUSD).
Resistance Levels
| Resistance Type | Price Level | Notes |
|---|---|---|
| Immediate Resistance | 4,098.23 | Immediate resistance |
| Key Resistance | 4,181.68 | Mid Bollinger Band |
| Major Resistance | 4,333.26 | Fibonacci 0.236 |
Support Levels
| Support Type | Price Level | Notes |
|---|---|---|
| Immediate Support | 4,023.86 | Immediate support |
| Key Support | 3,942.55 | Key support |
| Major Support | 3,886.64 | Major support |
Summary: Gold Technical Outlook
This Gold (XAUUSD) educational technical chart analysis for July 2, 2026 identifies a market where the downtrend remains intact, price sits below the March 2026 low, and RSI stays under 40 without reclaiming it. The swing-low trendline is the single structural feature holding the line against further downside.
If that trendline breaks, the next zone in focus is the 3,942.55 support. If the trendline continues to hold, a technical bounce toward resistance becomes the more interesting near-term story.
- Downtrend intact – price below the March 2026 low with a lower-low pattern
- RSI below 40, unreclaimed – bearish momentum picture
- Trendline from the last two swing lows has held on every test so far
- A trendline break shifts focus to 3,942.55 support; a held trendline opens the door to a bounce toward resistance
Want Expert Analysis on a Specific Asset?
Request a custom weekly chart interpretation of Equities, Cryptos, Commodities & Indices from Chartrick’s team of experienced technical analysts. Delivered to your inbox within 2 working days.
Important Disclaimer
All content on Chartrick, including charts, analysis reports, articles, and educational materials, is provided for general informational and educational purposes only. Nothing on this platform constitutes investment advice, financial advice, trading advice, or any recommendation to buy, sell, or hold any financial instrument. Financial markets carry risk, and past chart analysis does not guarantee future performance. All analysis is based on publicly available market data and is subject to change at any time. While every effort is made to ensure accuracy, Chartrick does not accept liability for any loss, damage, or financial outcome arising directly or indirectly from use of or reliance on this content, including any errors or omissions in the analysis. Users are solely responsible for their own investment and trading decisions and should exercise their own independent judgment.





