S&P 500 Daily: Consolidation Within the Broader Uptrend
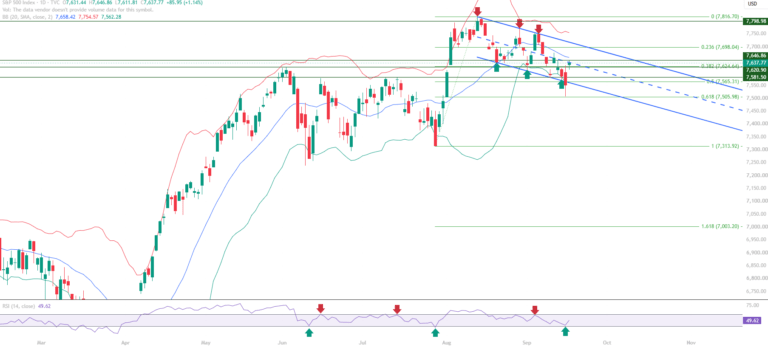
S&P Today: Review the S&P 500 market prediction, daily technical analysis, RSI momentum, support and resistance levels, and the broader market structure.

S&P Today: Review the S&P 500 market prediction, daily technical analysis, RSI momentum, support and resistance levels, and the broader market structure.
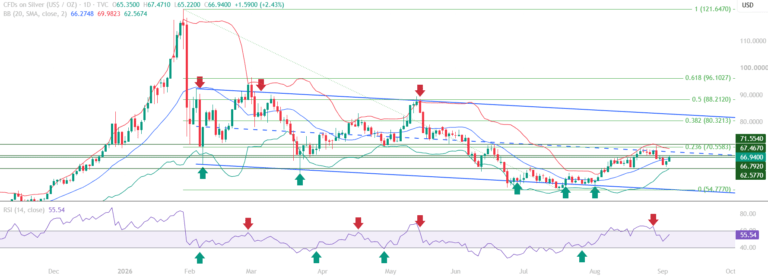
Silver Market Today, Silver remains in a broader downtrend and continues to trade within a downward-sloping trend channel.
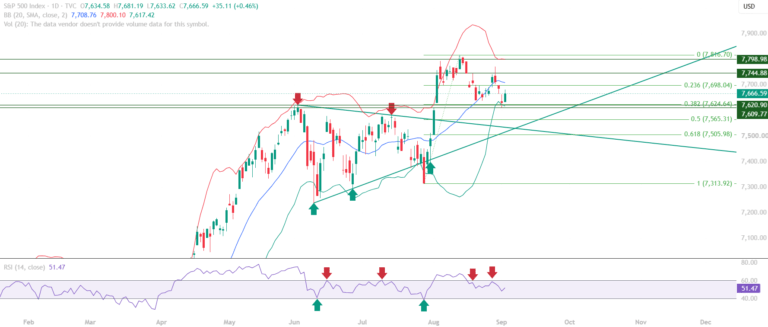
s&p 500 today is working through a consolidation phase after a strong multi-week rally carried price to a recent high near 7,798.98
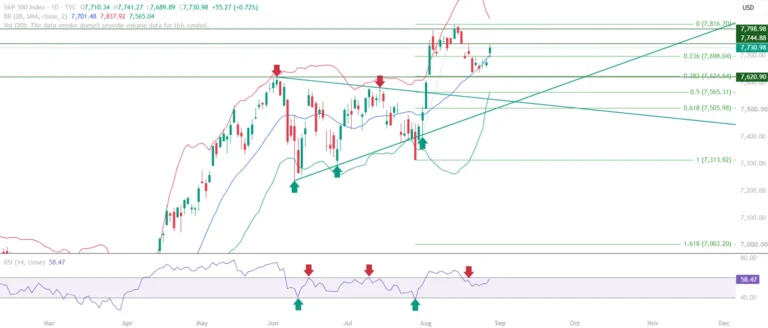
S&P 500 Index (SPX) examines a market that has moved from its recent rally into a consolidation phase.
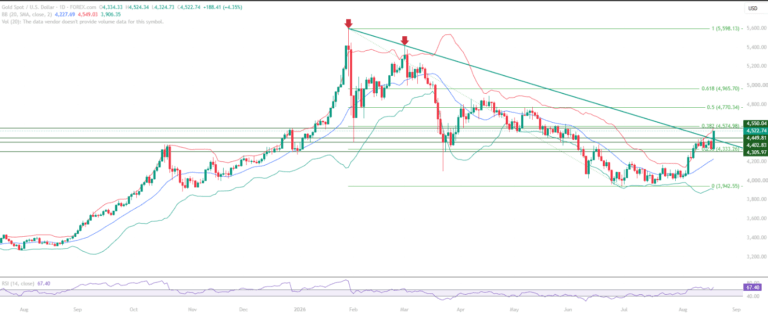
This Gold chart analysis identifies the break above the descending trendline as the foundational context for the current structure.
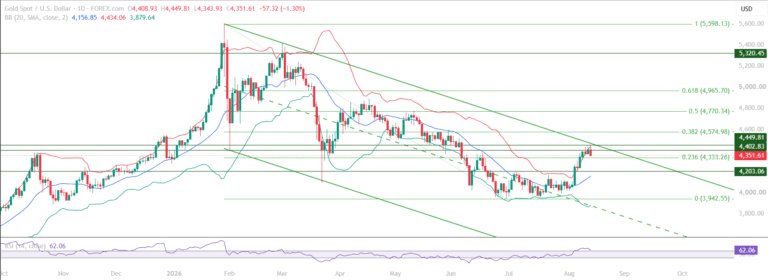
This Gold technical chart analysis examines a session that captured the tension in the current structure well.
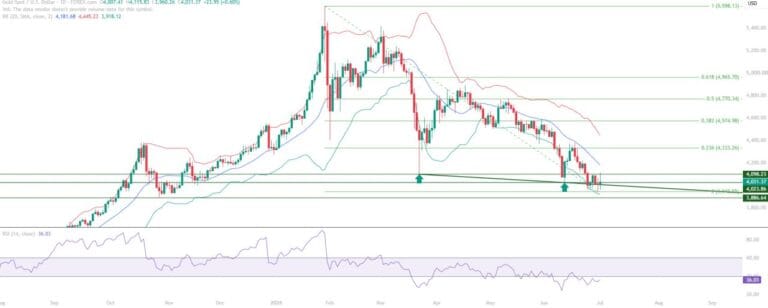
Gold Analysis : Price is trading below the March 2026 low, and the pattern of lower lows tells a clear story: sellers are still in control.
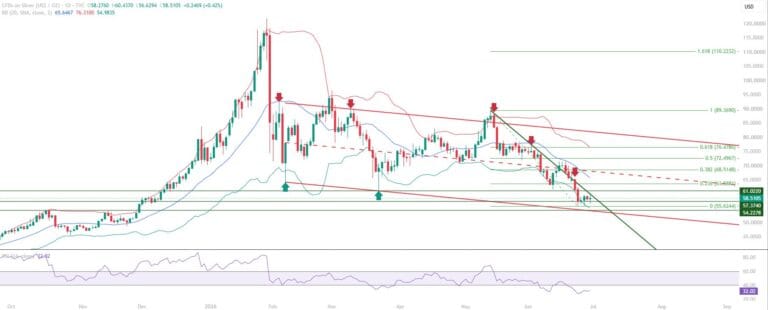
Silver is still trading below its March 2026 low. The RSI has slipped below 40, and hasn't been able to climb back above it. That's a meaningful shift in momentum.
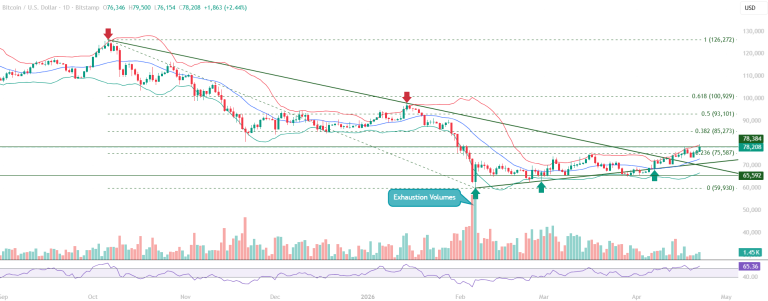
This Bitcoin chart analysis identifies the exhaustion volume signal from early February 2026 as the foundational context for the current structure.
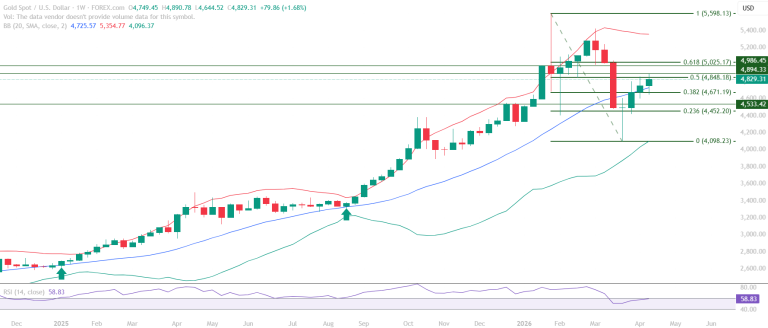
Gold weekly technical analysis for the week of April 20-24, 2026 identifies a market approaching a defining decision zone.





