
Weekly Analysis
Gold (XAUUSD) | Published by Chartrick’s Team of Experienced Technical Analysts
Opening paragraph
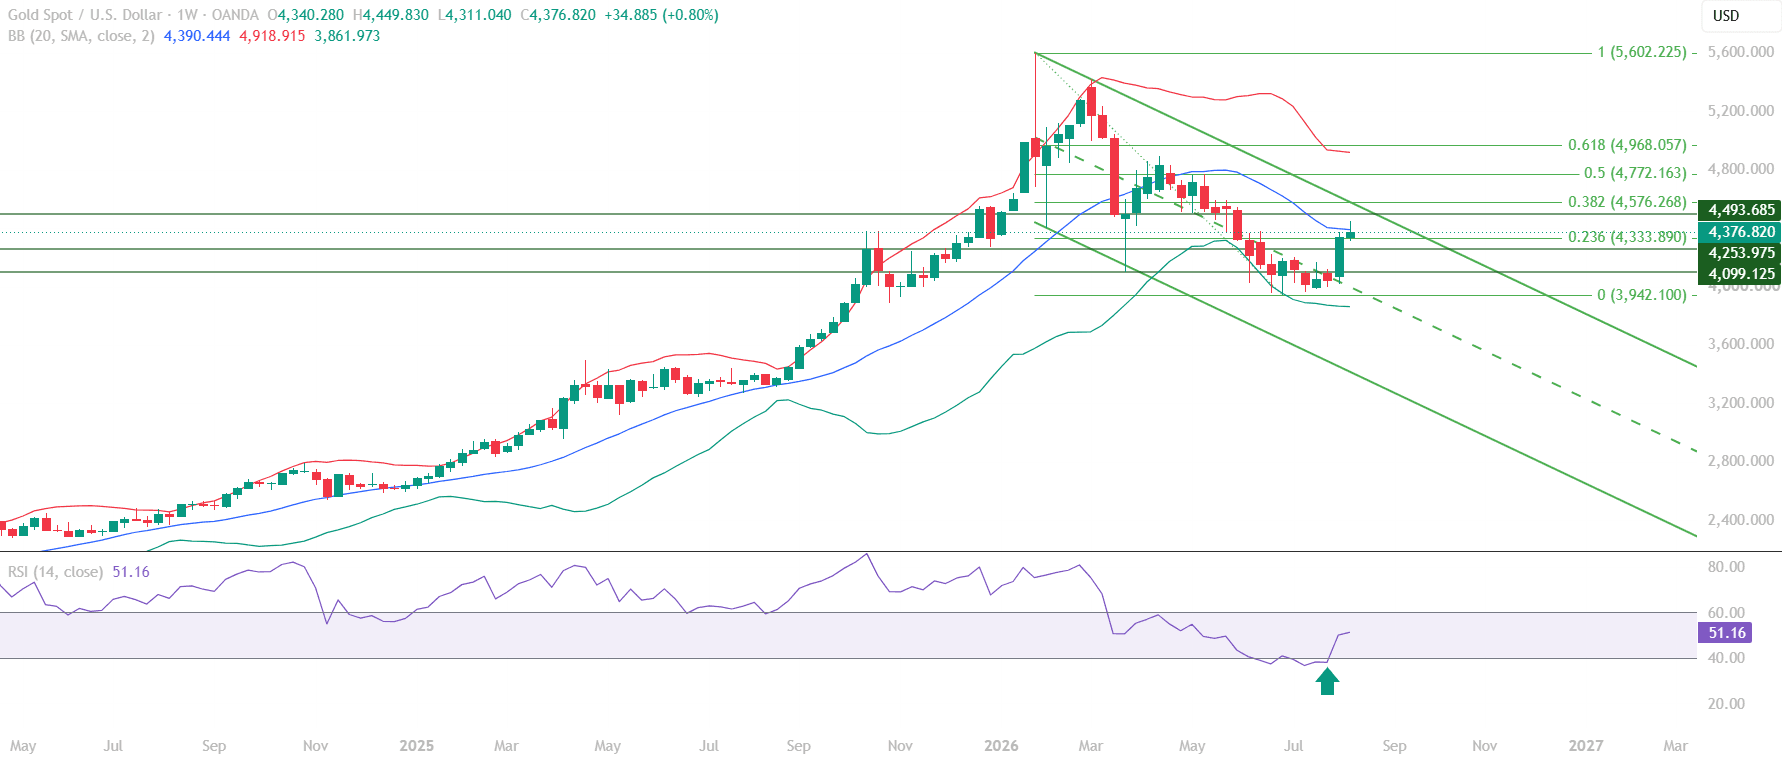
Gold enters the week of 17-21 August 2026 trading at 4376.82, having staged a technical bounce off the 3950-4000 base after finding renewed demand at lower levels. The recovery has lifted price into the 4333.89-4390.44 reaction zone, putting it directly beneath the Mid Bollinger Band at 4390.44, a level that makes the coming sessions an important test of whether this bounce can extend further.
The broader structure has been bearish for an extended period, with price confined to a descending channel on the weekly chart. This week’s setup follows a period of consolidation near the lows, where repeated tests of support around the 4099-4254 region appear to have built a base sturdy enough to support the current recovery attempt, even though the longer-term trend has not yet been broken.
All content on this page is educational technical chart analysis provided for informational purposes only. It does not constitute investment advice or any recommendation to buy, sell, or hold any financial instrument.
What Does the Current Gold Chart Structure Show?
On the weekly timeframe, gold remains inside a downward-sloping trend channel that has defined price action for an extended period, and this channel continues to frame the broader bearish structure even as the current bounce develops. Price action over recent weeks shows a shift from persistent selling toward stabilization, with the recovery from the 3950-4000 base building enough momentum to push price back toward the middle of the range.
The current bounce is occurring directly beneath the Mid Bollinger Band at 4390.44, which represents the most immediate hurdle for the recovery. How price behaves as it tests this level will be the key structural signal for the week.
- Solid base formation around 3950-4000 indicates renewed demand emerging at lower levels
- Price continues to trade inside a downward-sloping trend channel, keeping the long-term structure weak
- The Mid Bollinger Band at 4390.44 sits just above current price and may act as a near-term resistance zone
- The current move remains a technical bounce within the broader downtrend rather than a confirmed reversal
- A decisive break above the channel’s upper boundary together with the Mid Band would be the first structural sign of a deeper reversal
Why the 4333.89-4390.44 Zone Is the Key Signal This Week
The 4333.89-4390.44 range has become the immediate reaction zone for gold, and price is currently trading inside it. This band matters because it brings together the immediate support level (the Fibonacci 0.236 retracement) and the Mid Bollinger Band in one relatively narrow area. A rejection from the upper end of this zone would reinforce the broader downtrend and suggest the bounce is running out of room, while a sustained close above it would be the first real evidence that buyers are gaining control of the structure.
How Are the Technical Indicators Reading?
The RSI on the weekly chart previously found support near the 40 level before recovering toward 50, a shift that reflects improving momentum after an extended period of weakness. This kind of recovery from a support zone is typical of the early stages of a technical bounce, though it does not by itself confirm a change in the broader trend.
Bollinger Bands add further context to the current setup, with price trading right at the Mid Band at 4390.44. This level has historical relevance as a point where rallies within the downtrend have previously struggled, strengthening its significance as a resistance zone to watch this week.
- RSI recovered from a support zone near 40 toward the current 50 reading, indicating improving momentum
- A move back below RSI 40 would be an early signal that the bounce is losing strength
- Price is trading near the Mid Bollinger Band at 4390.44, a historically significant resistance area
- The Fibonacci 0.236 retracement at 4333.89 lines up with the immediate support level, reinforcing that zone
Key Technical Levels for Gold (XAUUSD)
The following levels represent the key zones market participants are likely watching as gold’s technical bounce is tested against the broader downtrend this week.
Resistance Levels
| Resistance Type | Price Level | Notes |
|---|---|---|
| Immediate Resistance | 4390.44 | Mid Bollinger Band |
| Key Resistance | 4493.68 | Next structural hurdle above the Mid Band |
| Major Resistance | 4576.26 | Fibonacci 0.382 retracement |
Support Levels
| Support Type | Price Level | Notes |
|---|---|---|
| Immediate Support | 4333.89 | Fibonacci 0.236 retracement |
| Key Support | 4253.97 | Base of the broader reaction zone |
| Major Support | 4099.12 | Deeper structural support near the base |
Summary: Gold Technical Outlook
Gold’s weekly chart shows a market in transition, with a technical bounce developing from a solid base around 3950-4000 even as the broader trend channel continues to point lower. At 4376.82, price sits within the 4333.89-4390.44 reaction zone, and the coming sessions should clarify whether this recovery can push through the Mid Bollinger Band or whether the longer-term downtrend will reassert itself.
The improvement in RSI momentum toward 50 supports the case for continued near-term strength, but a confirmed reversal would still require a decisive break above the Mid Band and the channel’s upper boundary. Until that happens, the broader structure remains defined by the descending channel, and the current move is best read as a bounce within that structure rather than a trend change.
- Gold trades at 4376.82, just beneath the Mid Bollinger Band at 4390.44
- The technical bounce is developing from a solid base formed around 3950-4000
- RSI has recovered from support near 40 toward 50, reflecting improving momentum
- The 4333.89-4390.44 zone is the immediate reaction range deciding the bounce’s next move
- The broader downward-sloping trend channel remains intact until resistance is decisively cleared
See our previous Gold (XAUUSD) analysis here: [LINK: previous XAUUSD post]. For related precious metals context, see our latest Silver (XAGUSD) analysis: [LINK: latest XAGUSD post].
Want Expert Analysis on a Specific Asset?
Request a custom weekly chart interpretation of Equities, Cryptos, Commodities & Indices from Chartrick’s team of experienced technical analysts. Delivered to your inbox within 2 working days.
Important Disclaimer
All content on Chartrick, including charts, analysis reports, articles, and educational materials, is provided for general informational and educational purposes only. Nothing on this platform constitutes investment advice, financial advice, trading advice, or any recommendation to buy, sell, or hold any financial instrument. Financial markets carry risk, and past chart analysis does not guarantee future performance. All analysis is based on publicly available market data and is subject to change at any time. While every effort is made to ensure accuracy, Chartrick does not accept liability for any loss, damage, or financial outcome arising directly or indirectly from use of or reliance on this content, including any errors or omissions in the analysis. Users are solely responsible for their own investment and trading decisions and should exercise their own independent judgment.





