
Weekly Analysis
Bitcoin (BTC) | Published by Chartrick’s Team of Experienced Technical Analysts
Opening paragraph
Bitcoin (BTC) educational technical chart analysis for the week of 17 to 21 August 2026 examines a consolidation phase forming just above recent lows. Price closed the prior week at 62,832, holding below the downward-sloping trendline that has defined the broader corrective structure, while RSI has slipped below the 40 level, confirming weak short-term momentum heading into the new week.
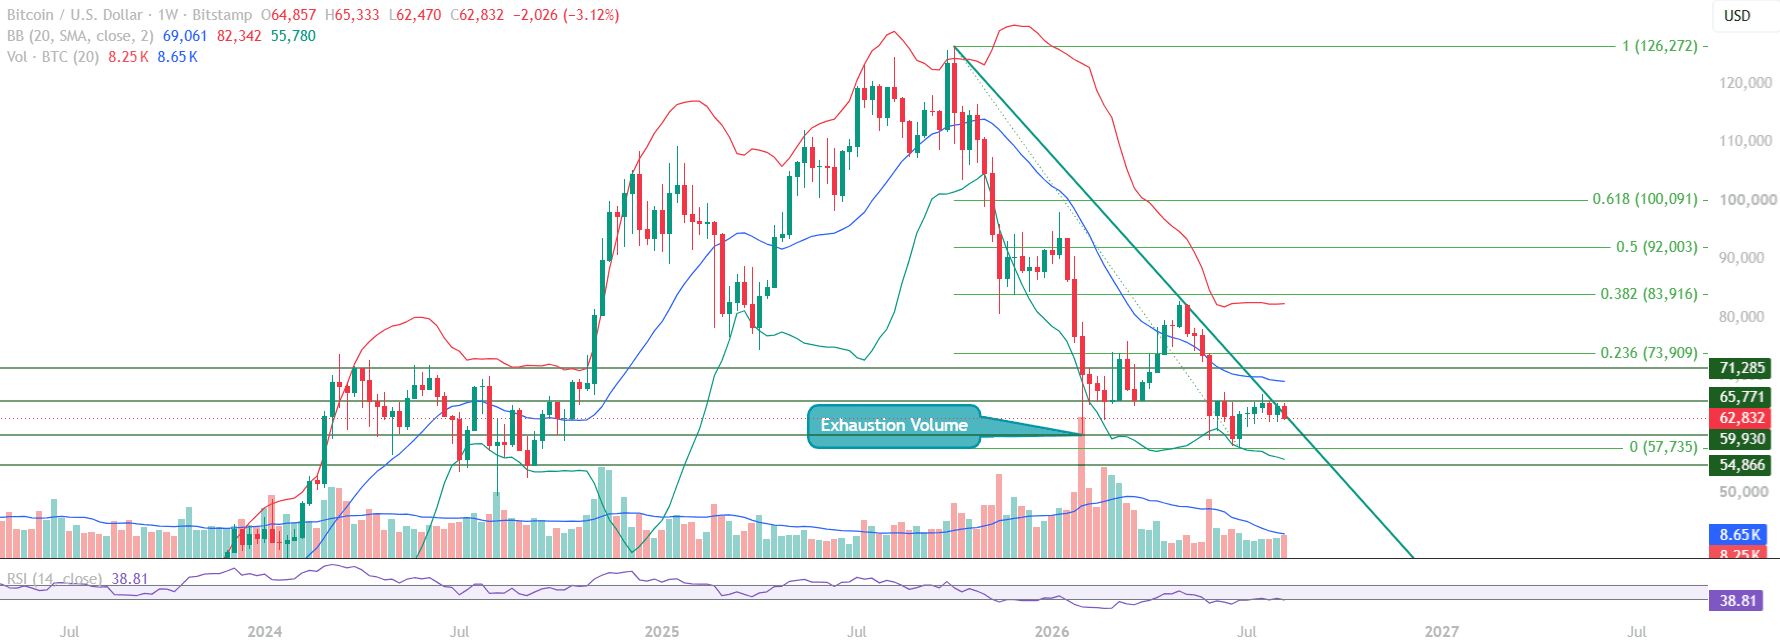
This Bitcoin chart analysis identifies the exhaustion volume signal from early February as the foundational context for the current structure. Elevated sell-side volume that failed to drive price meaningfully lower marked an early stage of demand absorption at lower levels, and price has largely held that zone through the following months. The week of 17 to 21 August represents a continuation of that consolidation, with the market still searching for direction between the immediate support and resistance zones.
All content on this page is educational technical chart analysis provided for informational purposes only. It does not constitute investment advice or any recommendation to buy, sell, or hold any financial instrument.
What Does the Current Bitcoin Chart Structure Show?
The weekly Bitcoin (BTC) chart reflects a sharp consolidation phase between 57,735 and 65,771, following a broader downtrend that has been in place since the prior cycle’s high. Price is currently trading below the downward-sloping trendline formed during this corrective move, and that trendline continues to act as the key structural barrier standing between the current range and any meaningful recovery attempt.
Momentum readings support this cautious read. RSI has crossed below the 40 level, a threshold that has historically separated genuine recovery attempts from failed bounces within this downtrend. Price is also trading well below the Mid Bollinger Band level of 69,061, reinforcing that the broader structure remains corrective even as the pace of the decline has slowed near current levels.
- Sharp consolidation phase between 57,735 and 65,771 following the broader downtrend
- Price closed below the downward-sloping trendline, which remains the key resistance barrier
- RSI has crossed below the 40 level, confirming weak short-term momentum
- Mid Bollinger Band at 69,061 sits well above current price, reinforcing the corrective structure
- Early signs of demand absorption visible near the lower end of the consolidation range
The Exhaustion Volume Signal
The exhaustion volume pattern from early February remains the most significant structural signal in this Bitcoin chart analysis. Elevated sell-side volume that failed to produce meaningfully lower prices is a technical pattern often associated with diminishing selling conviction rather than continued distribution. Markets do not turn on price alone, and the failure of that volume spike to break the structure lower is worth noting in any educational technical chart analysis of this period. The consolidation that has held since is consistent with early base formation, though it has not yet been confirmed by a shift in trend.
How Are the Technical Indicators Reading?
RSI analysis in this Bitcoin educational technical chart analysis shows the momentum indicator sitting below the 40 level, a structural threshold that has repeatedly separated failed bounce attempts from genuine recovery phases during this downtrend. A sustained move back above 40 would be the first technical indication that momentum is turning, and the market will be watching this closely through the week.
Bollinger Band positioning adds further context. The Mid Bollinger Band at 69,061 remains well above current price, marking the level at which price would need to close to meaningfully shift the near-term technical picture. Fibonacci retracement levels drawn from the broader downtrend, most notably the 0.236 level at 73,909, sit further above still and represent the next reference points should the current resistance zone eventually give way.
- RSI below 40, confirming weak short-term momentum heading into the week
- Mid Bollinger Band at 69,061 remains a key overhead resistance zone
- Fibonacci 0.236 at 73,909 is the next major reference point above current resistance
- Exhaustion volume from early February continues to support the base-formation read
Key Technical Levels for Bitcoin (BTC)
The following levels are identified in this Bitcoin educational technical chart analysis. All levels are derived from expert chart analysis using publicly available market data.
Resistance Levels
| Resistance Type | Price Level | Notes |
|---|---|---|
| Immediate Resistance | 65,771 | Descending trendline area, immediate resistance zone |
| Key Resistance | 69,061 | Mid Bollinger Band level |
| Major Resistance | 73,909 | Fibonacci 0.236 retracement |
Support Levels
| Support Type | Price Level | Notes |
|---|---|---|
| Immediate Support | 59,930 | Immediate support within the consolidation range |
| Key Support | 57,735 | Key support, lower boundary of the current range |
| Strong Support | 54,866 | Strong support below the immediate consolidation zone |
Summary: Bitcoin Technical Outlook
This Bitcoin (BTC) educational technical chart analysis for the week of 17 to 21 August 2026 identifies a market in consolidation, with early signs of demand absorption offset by momentum that remains weak. The exhaustion volume signal from early February, RSI below 40, and price sitting below the downward-sloping trendline together describe a structure that has stabilized but not yet reversed.
The 65,771 level, at the descending trendline, is the level that defines the near-term resolution for this range. A close above it, together with RSI sustaining above 40, would strengthen the case for a broader recovery attempt. Conversely, a break below 59,930 toward the 57,735 to 54,866 zone would suggest the broader downtrend is reasserting itself rather than giving way to a base formation.
- Bitcoin is consolidating between 57,735 and 65,771, within a broader downtrend
- RSI has crossed below 40, confirming weak short-term momentum
- Price remains below the downward-sloping trendline, the key resistance barrier
- Exhaustion volume from early February continues to support an early base-formation read
- A close above 65,771 with RSI back above 40 would strengthen the recovery case
See our previous Bitcoin analysis [LINK: previous BTC post] for the structural context behind this week’s consolidation, and check our broader crypto coverage [LINK: crypto market analysis] for how altcoins are behaving alongside BTC.
Want Expert Analysis on a Specific Asset?
Request a custom weekly chart interpretation of Equities, Cryptos, Commodities & Indices from Chartrick’s team of experienced technical analysts. Delivered to your inbox within 2 working days.
Important Disclaimer
All content on Chartrick, including charts, analysis reports, articles, and educational materials, is provided for general informational and educational purposes only. Nothing on this platform constitutes investment advice, financial advice, trading advice, or any recommendation to buy, sell, or hold any financial instrument. Financial markets carry risk, and past chart analysis does not guarantee future performance. All analysis is based on publicly available market data and is subject to change at any time. While every effort is made to ensure accuracy, Chartrick does not accept liability for any loss, damage, or financial outcome arising directly or indirectly from use of or reliance on this content, including any errors or omissions in the analysis. Users are solely responsible for their own investment and trading decisions and should exercise their own independent judgment.





