The Relative Strength Index – universally known as RSI – is one of the most widely referenced indicators in technical chart analysis. It appears in every market Chartrick covers, from the S&P 500 (SPX) and Gold (XAUUSD) to Brent Crude Oil and Bitcoin (BTC), and is a standard component of Chartrick’s daily structured market analysis across all five core assets.
Yet despite its widespread use, RSI is frequently misread. Investors encountering RSI for the first time often apply rigid interpretations – treating an overbought reading as an automatic sell signal or an oversold reading as a guaranteed floor. Understanding how RSI actually works, and what it does and does not tell an analyst, is essential for anyone seeking to interpret financial charts with precision.
This guide explains how to read RSI correctly, drawing on the analytical approach that Chartrick’s team of experienced technical analysts applies daily.
All content in this guide is educational technical chart analysis provided for informational purposes only. It does not constitute investment advice or any recommendation to buy, sell, or hold any financial instrument.
What Is RSI?
RSI (Relative Strength Index) is a momentum oscillator that measures the speed and magnitude of recent price changes in a financial instrument. It was developed by technical analyst J. Welles Wilder Jr. and introduced in 1978. It remains one of the most widely used indicators in financial chart analysis more than four decades later.
RSI produces a single numerical value that oscillates between 0 and 100. This value reflects the ratio of average upward price movement to average downward price movement over a defined lookback period. The standard lookback period is 14 periods – meaning on a daily chart, RSI calculates using the prior 14 trading days of price data.
What RSI measures is momentum – the rate at which price is moving, and whether recent upward or downward moves are dominant. It does not measure the direction of price, it does not predict future price movement, and it does not account for fundamental data. It is a pure measure of the speed and character of recent price action.
How to Read the RSI Scale
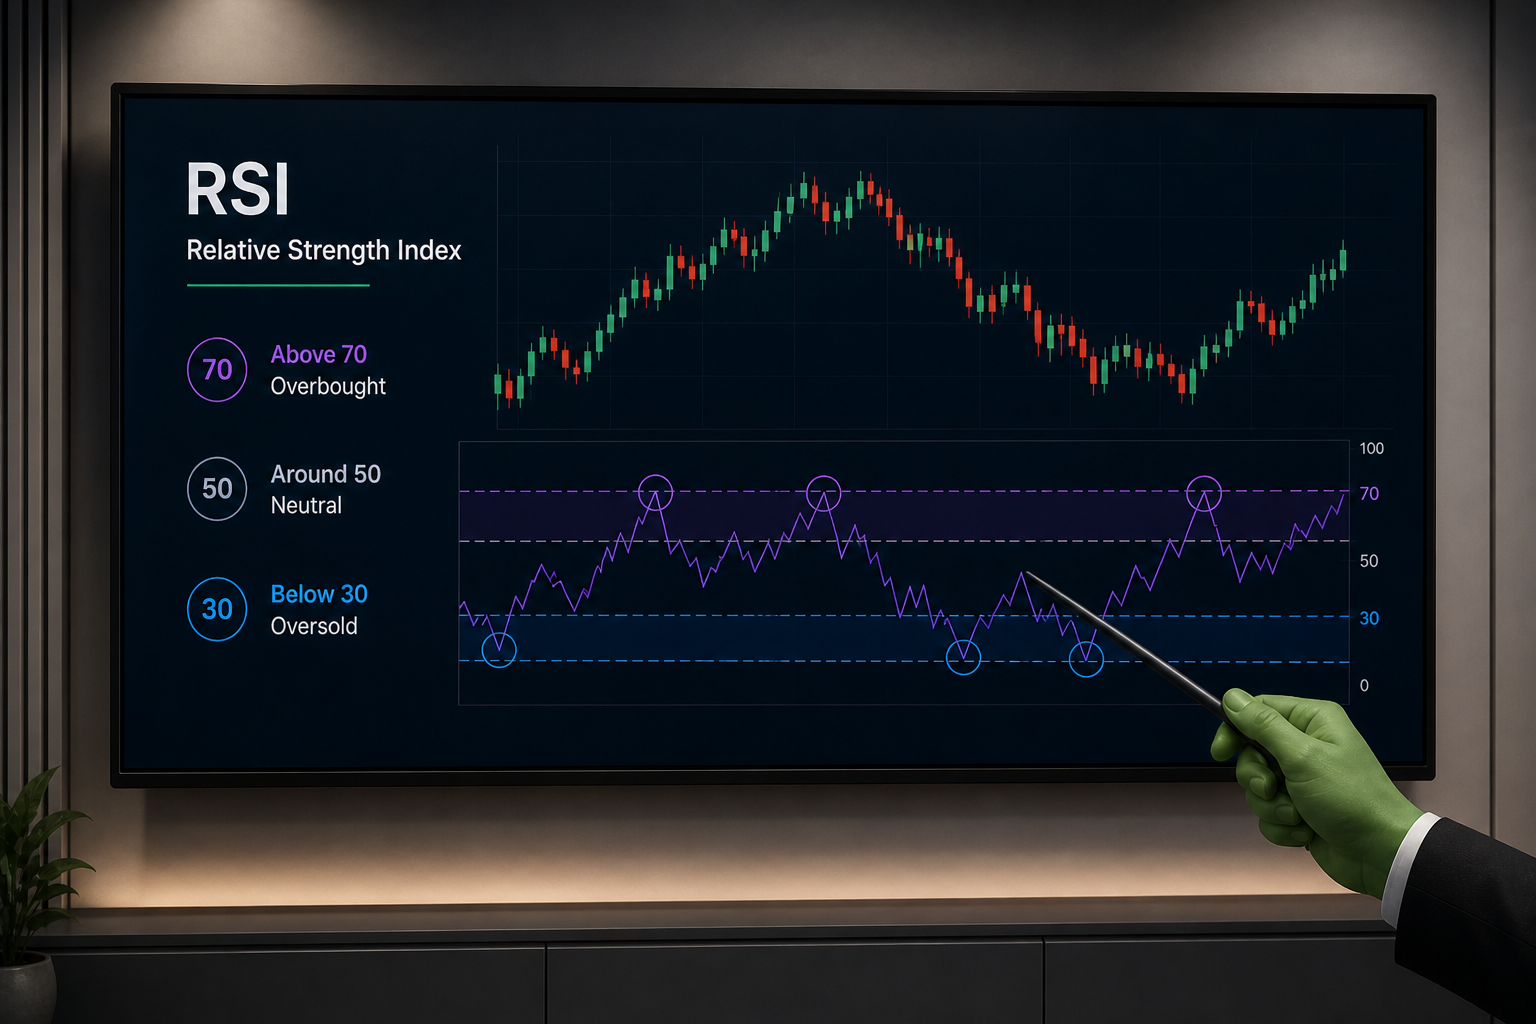
RSI values are plotted on a scale of 0 to 100. Three reference points are universally used in technical chart analysis:
- RSI above 70 – conventionally described as overbought, indicating that upward price momentum has been relatively strong over the lookback period
- RSI below 30 – conventionally described as oversold, indicating that downward price momentum has been relatively strong over the lookback period
- RSI at 50 – the neutral midpoint, historically associated with the transition between momentum-positive and momentum-negative conditions
These are reference points for contextual analysis, not mechanical triggers. Their interpretation depends entirely on the broader chart structure – specifically, whether the market is trending, consolidating, or in a transition phase.
What Does Overbought RSI Actually Mean?
An overbought RSI reading (above 70) indicates that upward price momentum has been relatively strong and sustained over the recent lookback period. It is a statistical observation about the character of recent price movement.
It does not mean that price must fall, will fall, or that a reversal is imminent. In strongly trending markets, RSI can remain in overbought territory for extended periods – sometimes weeks or months. A market can be technically overbought on an RSI basis and continue advancing significantly before any directional change occurs.
Treating an overbought RSI reading as an automatic reversal signal without reference to trend structure is one of the most common analytical errors in chart analysis. Overbought RSI in a strong uptrend is a momentum confirmation, not a warning.
What Does Oversold RSI Actually Mean?
An oversold RSI reading (below 30) indicates that downward price momentum has been relatively strong and sustained. Again, it is a statistical observation – not a reversal guarantee.
Markets in strong downtrends can remain oversold on an RSI basis for extended periods while price continues declining. Oversold RSI readings carry the most analytical weight when they coincide with a key structural support level – for example, a significant Fibonacci retracement level, a major prior swing low, or the lower Bollinger Band at a historically significant price zone.
In isolation, an oversold RSI reading tells an analyst that recent downward momentum has been strong. In combination with a significant support level and a high-volume candle, it becomes part of a technically meaningful picture.
RSI readings should never be interpreted in isolation. Chartrick’s analysts always contextualise RSI within the prevailing trend structure and alongside Bollinger Band positioning and volume signals before drawing any analytical conclusion.
What Is RSI Divergence?
RSI divergence is one of the most significant signals that RSI analysis can produce. Divergence occurs when the direction of price movement and the direction of RSI momentum are in conflict – meaning price makes a new high or low that RSI does not confirm.
Bullish RSI Divergence
Bullish divergence occurs when price makes a lower low while RSI makes a higher low. This indicates that while price has continued declining to a new low, the momentum behind the decline is weakening – the speed and magnitude of the downward move has reduced relative to the prior leg lower.
Chartrick’s analysts identify bullish divergence as a technically noteworthy condition when it occurs at key structural support levels. The divergence alone is not sufficient – it requires confluence with a structurally significant price zone to carry full analytical weight.
Bearish RSI Divergence
Bearish divergence occurs when price makes a higher high while RSI makes a lower high. This indicates that while price has continued advancing to a new high, the momentum behind the advance is weakening.
Bearish divergence at key structural resistance levels is treated as analytically significant in Chartrick’s daily structured market analysis. As with bullish divergence, the signal is strongest when it forms at a price level that has independent technical significance.
Divergence signals are analytical observations that warrant attention – not automatic action triggers. They are most meaningful in the context of the prevailing trend structure and at technically significant price levels.
RSI Behaviour in Trending vs. Ranging Markets
The analytical application of RSI differs meaningfully depending on whether a market is trending or ranging. Understanding this distinction is central to reading RSI correctly.
RSI in Trending Markets
In strongly trending markets, RSI tends to oscillate within directionally biased ranges rather than swinging between 30 and 70 symmetrically.
- In an uptrend – RSI commonly fluctuates between approximately 40 and 80, with pullbacks holding above 40 and advances extending into overbought territory
- In a downtrend – RSI commonly oscillates between approximately 20 and 60, with rallies failing below 60 and declines pushing into oversold territory
- When RSI consistently holds within a trending range, it provides additional confirmation of the prevailing trend’s strength and character
RSI in Ranging (Consolidating) Markets
In ranging or consolidating markets, RSI tends to oscillate more symmetrically around the 50 midpoint. In these conditions, overbought and oversold readings carry relatively more analytical weight, as momentum extremes in a ranging environment are more likely to mark the boundaries of the range than they are in a trending environment.
Identifying whether a market is trending or ranging before interpreting RSI is therefore the essential first step in RSI analysis. This is why Chartrick’s daily analysis always begins with a market structure assessment before moving to indicator interpretation.
How Chartrick Uses RSI in Daily Analysis
Chartrick’s team of experienced technical analysts applies RSI analysis consistently across all five core markets in every daily educational technical chart analysis:
- Current RSI value is stated with precision – not described generically as ‘elevated’ or ‘depressed’ but given as a specific number
- RSI momentum direction is assessed – rising, falling, or flattening – as a secondary dimension beyond the raw value
- RSI divergence is flagged explicitly when present, with the specific price levels at which the divergence has formed identified
- RSI interpretation is placed in the context of prevailing trend structure – a reading above 70 in a strong uptrend is characterised differently from the same reading at a major long-term resistance level
- RSI is integrated with Bollinger Band positioning and volume signals to form a composite technical picture rather than a single-indicator conclusion
Chartrick’s daily structured market analysis states a specific RSI value for each asset covered, contextualised within the prevailing trend structure. Readers receive a precise momentum reading, not a generic characterisation.
See RSI Analysis Applied Across All Five Markets
Chartrick publishes daily educational technical chart analysis covering RSI, Bollinger Bands, volume, trend structure, and key levels for S&P 500, Gold (XAUUSD), Silver (XAGUSD), Brent Crude Oil, and Bitcoin (BTC).
Common RSI Mistakes to Avoid
Understanding what RSI does not do is as important as understanding what it measures. These are the most common analytical errors when applying RSI:
- Treating overbought as a sell signal – in trending markets, overbought RSI often persists for extended periods while price continues advancing
- Treating oversold as a buy signal – in downtrends, oversold RSI can remain depressed while price continues declining
- Reading RSI in isolation – RSI carries meaningful analytical weight only when interpreted alongside trend structure, support and resistance levels, Bollinger Bands, and volume
- Using a single timeframe – RSI on the daily chart can look very different from RSI on the weekly chart; multi-timeframe RSI analysis provides a more complete picture
- Ignoring divergence – RSI divergence at structurally significant price levels is one of the most analytically valuable signals the indicator produces, yet it is frequently overlooked
Key Takeaways: How to Read RSI
- RSI measures the speed and magnitude of recent price changes on a scale of 0 to 100
- Readings above 70 are overbought; readings below 30 are oversold – these are contextual reference points, not automatic signals
- In trending markets, overbought and oversold conditions can persist for extended periods
- RSI divergence – when price and RSI momentum conflict – is one of the most analytically significant signals the indicator produces
- RSI in trending markets operates within directionally biased ranges, not symmetrically between 30 and 70
- RSI interpretation always requires trend structure and multi-indicator context to be analytically meaningful
- Chartrick states a specific RSI value for each asset in every daily structured market analysis
Want Expert Chart Analysis for a Specific Asset?
Request educational technical chart analysis, for any Equities, Commodity, or Cryptocurrency and Indices delivered within 2 working days.
Decoding the Language of Charts.
Important Disclaimer
All content on Chartrick, including charts, analysis reports, articles, and educational materials, is provided for general informational and educational purposes only. Nothing on this platform constitutes investment advice, financial advice, trading advice, or any recommendation to buy, sell, or hold any financial instrument. Financial markets carry risk, and past chart analysis does not guarantee future performance. All analysis is based on publicly available market data and is subject to change at any time. While every effort is made to ensure accuracy, Chartrick does not accept liability for any loss, damage, or financial outcome arising directly or indirectly from use of or reliance on this content, including any errors or omissions in the analysis. Users are solely responsible for their own investment and trading decisions and should exercise their own independent judgment.