Weekly Analysis
Gold (XAUUSD) | Published by Chartrick’s Team of Experienced Technical Analysts
Key Insight
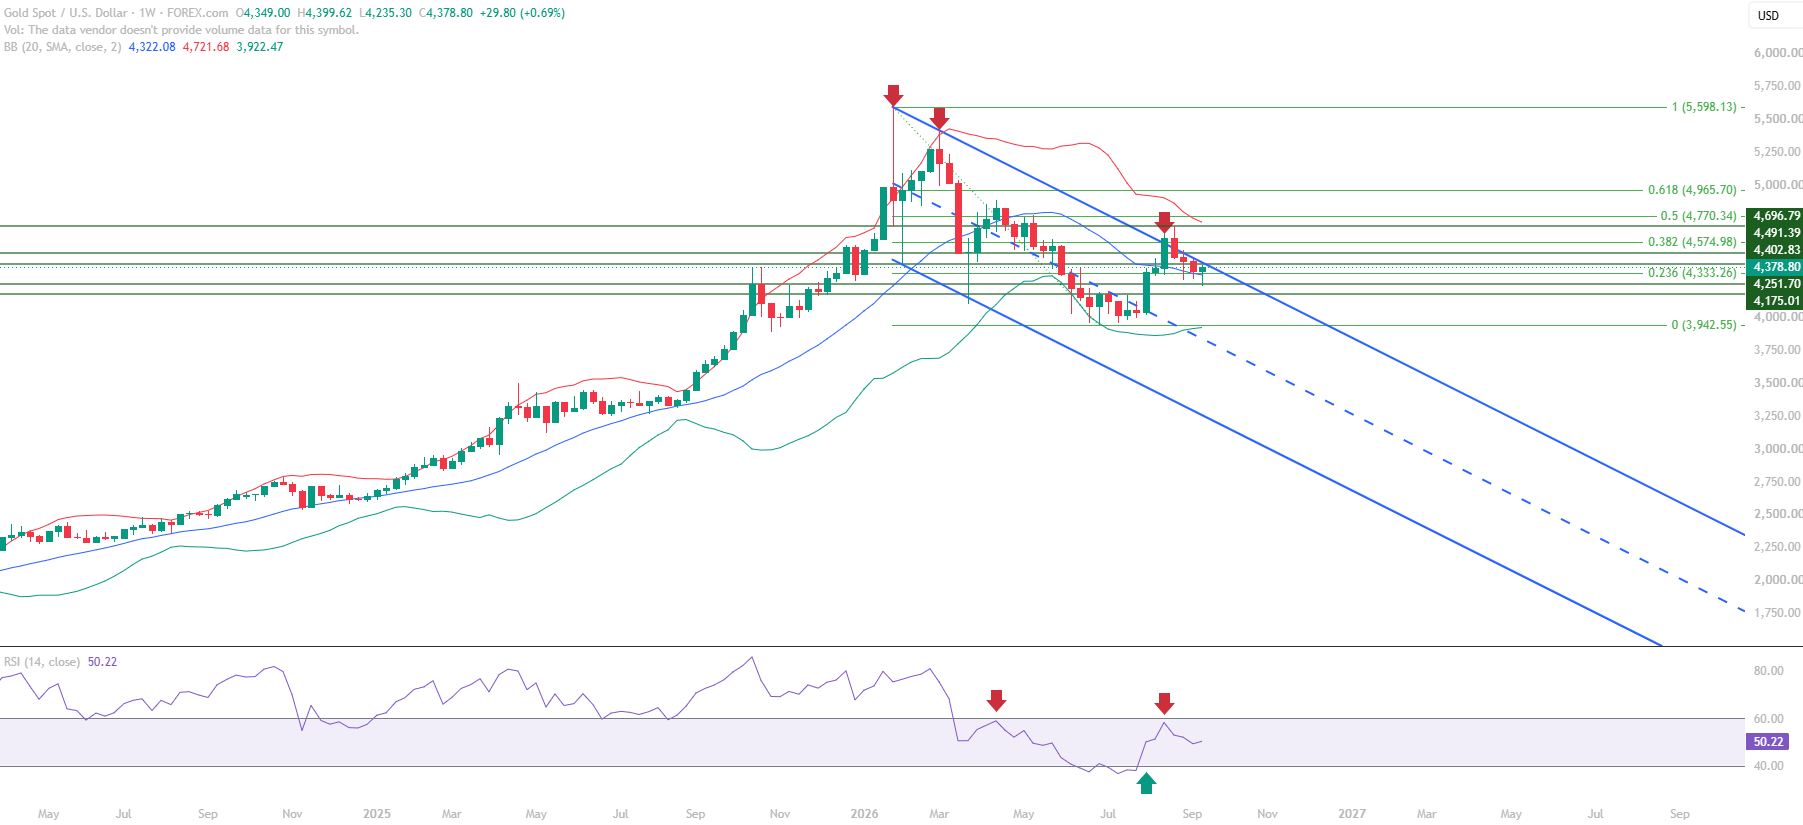
This Gold (XAUUSD) educational technical chart analysis for 21 September – 25 September 2026 shows a market that remains inside a broader bearish structure while developing a potential trend-reversal setup from the 3,950-4,000 base. The weekly chart closed on 18 September 2026 at a CMP of 4,378.80, with RSI at 50.22 pointing to a potential range shift into the 40-60 zone.
The foundational context for this Gold chart analysis is a failed breakout. Gold’s earlier attempt to move above the upper boundary of the downward-sloping trend channel did not sustain, followed by rejection near the 0.382 Fibonacci resistance at 4,574.98 and a pullback from the recent high of 4,696.79. The 4,251.70 – 4,402.83 area will be important in determining whether the recovery regains momentum or develops into a deeper correction.
All content on this page is educational technical chart analysis provided for informational purposes only. It does not constitute investment advice or any recommendation to buy, sell, or hold any financial instrument.
What Does the Current Gold Chart Structure Show?
The weekly Gold (XAUUSD) chart shows a market that remains in a broader downtrend, yet a potential base formation has developed around the recent lows near 3,950-4,000. The recovery from that base provides the basis for the potential trend-reversal setup described in this educational technical chart analysis, which is why the current market structure carries both a bearish backdrop and an early recovery attempt.
Price attempted to break above the upper boundary of the downward-sloping trend channel but could not sustain the move, with rejection near the Fibonacci 0.382 level at 4,574.98 and a pullback from the recent high of 4,696.79. With a CMP of 4,378.80, price now trades below the upper boundary of the channel and inside the 4,251.70 – 4,402.83 reaction zone, close to the confluence of Fibonacci 0.236 and the Mid Bollinger Band around 4,333.
- A potential base formation has developed around the recent lows near 3,950-4,000
- The recovery from this base provides the basis for a potential trend-reversal setup
- Price failed to sustain above the upper boundary of the downward-sloping trend channel
- Rejection came near the Fibonacci 0.382 resistance at 4,574.98, followed by a pullback from the recent high of 4,696.79
- Price is trading within the 4,251.70 – 4,402.83 critical zone, near the Fibonacci 0.236 and Mid Bollinger Band confluence around 4,333
Why the Failed Trend Channel Breakout Is the Key Signal
A trend channel gives price a defined structural framework, and the upper boundary of a downward-sloping channel is the line that separates a continuing downtrend from a genuine change in structure. Gold moved above that boundary and could not sustain the move, which means the broader bearish structure has not been invalidated. The pullback from the recent high of 4,696.79 returned price to the region below the boundary, keeping the technical picture within the downtrend framework.
This is why the signal carries weight in this Gold weekly technical analysis. The reversal case is tied to a decisive reclaim of the downward-sloping trend channel, together with a sustained move above RSI 60 and resistance at 4,574.98. Until those conditions develop, the recovery remains a technical bounce within the broader bearish structure, and the base near 3,950-4,000 remains the foundation that gives the setup its potential.
How Are the Technical Indicators Reading?
RSI (Relative Strength Index)
RSI stands at 50.22 on the weekly chart. Momentum may be shifting into the 40-60 RSI range while the broader downtrend remains intact. RSI previously found support around 40 but did not sustain above 60, so a sustained move above RSI 60 would be needed to provide stronger confirmation of improving momentum.
Bollinger Bands
Price is trading above the Mid Bollinger Band at 4,322.08, which may act as a key support zone in the near term. The Mid Bollinger Band sits alongside Fibonacci 0.236 at 4,333.26 to form the confluence zone that acts as the immediate support area on this Gold chart.
Fibonacci Analysis
The Fibonacci retracement levels on the chart are 0 at 3,942.55, 0.236 at 4,333.26, 0.382 at 4,574.98, 0.5 at 4,770.34 and 0.618 at 4,965.70. The 0.236 level forms part of the immediate support confluence with the Mid Bollinger Band, while 0.382 at 4,574.98 is where the rejection occurred. The 0.5 level at 4,770.34 and the 0.618 level at 4,965.70 sit above the recent high of 4,696.79 and have not been reached.
Trend Channel
Price attempted to break above the upper boundary of the downward-sloping trend channel but failed to sustain the breakout, followed by a pullback. Price is currently trading below the upper boundary, so a decisive reclaim of the channel remains the structural development that would strengthen the trend-reversal case.
Key Technical Levels for Gold (XAUUSD)
The following support and resistance levels are identified in this Gold educational technical chart analysis. All levels are derived from expert chart analysis using publicly available market data.
Resistance Levels
| Resistance Type | Price Level | Notes |
|---|---|---|
| Immediate Resistance | 4,402.83 | Immediate resistance, sits above the CMP of 4,378.80 |
| Key Resistance | 4,491.39 | Key resistance level |
| Major Resistance | 4,574.98 | Fibonacci 0.382, where price was rejected |
| Recent High / Breakout Reference | 4,696.79 | Recent high and breakout reference |
Support Levels
| Support Type | Price Level | Notes |
|---|---|---|
| Immediate Support | 4,333.26-4,322.08 | Confluence of Fibonacci 0.236 and Mid Bollinger Band |
| Key Support | 4,251.70 | Key support level |
| Major Support | 4,175.01 | Major support level |
Summary: Gold Technical Outlook
This Gold (XAUUSD) educational technical chart analysis for 21 September – 25 September 2026 describes a broader downtrend with a potential trend-reversal setup built from the 3,950-4,000 base. The failed breakout above the downward-sloping trend channel, the rejection near 4,574.98, and RSI at 50.22 in a potential 40-60 range shift together define the current structure at a CMP of 4,378.80.
The 4,251.70 – 4,402.83 reaction zone is where the near-term direction will be shaped, with immediate resistance at 4,402.83 above price and the 4,333.26-4,322.08 confluence zone below it. The chart structure context reads as a technical bounce in the short term, a potential momentum range shift in the medium term, and a broader downtrend that remains intact in the long term unless key resistance levels are reclaimed. Risk factors cited in the analysis include geopolitical tensions, US Dollar movement and the global demand outlook.
- Broader downtrend remains intact, with a potential trend-reversal setup from the 3,950-4,000 base
- The breakout above the downward-sloping trend channel failed to sustain, with rejection near Fibonacci 0.382 at 4,574.98
- RSI at 50.22 shows a potential range shift into the 40-60 zone, and a sustained move above RSI 60 would provide stronger confirmation
- The 4,333.26-4,322.08 confluence of Fibonacci 0.236 and the Mid Bollinger Band is the immediate support area
- Immediate resistance at 4,402.83 sits above price, with key resistance at 4,491.39 as the next level
- A decisive reclaim of the channel and resistance at 4,574.98 would strengthen the reversal case; until then the recovery remains a technical bounce
Subscribe to Get Weekly Analysis in Your Inbox
Get weekly technical chart analysis on S&P 500, Gold, Silver, Brent Crude and Bitcoin delivered straight to your inbox.
Important Disclaimer
All content on Chartrick, including charts, analysis reports, articles, and educational materials, is provided for general informational and educational purposes only. Nothing on this platform constitutes investment advice, financial advice, trading advice, or any recommendation to buy, sell, or hold any financial instrument. Financial markets carry risk, and past chart analysis does not guarantee future performance. All analysis is based on publicly available market data and is subject to change at any time. While every effort is made to ensure accuracy, Chartrick does not accept liability for any loss, damage, or financial outcome arising directly or indirectly from use of or reliance on this content, including any errors or omissions in the analysis. Users are solely responsible for their own investment and trading decisions and should exercise their own independent judgment.