Weekly Analysis
Silver (XAGUSD) | Published by Chartrick’s Team of Experienced Technical Analysts
Key Insight
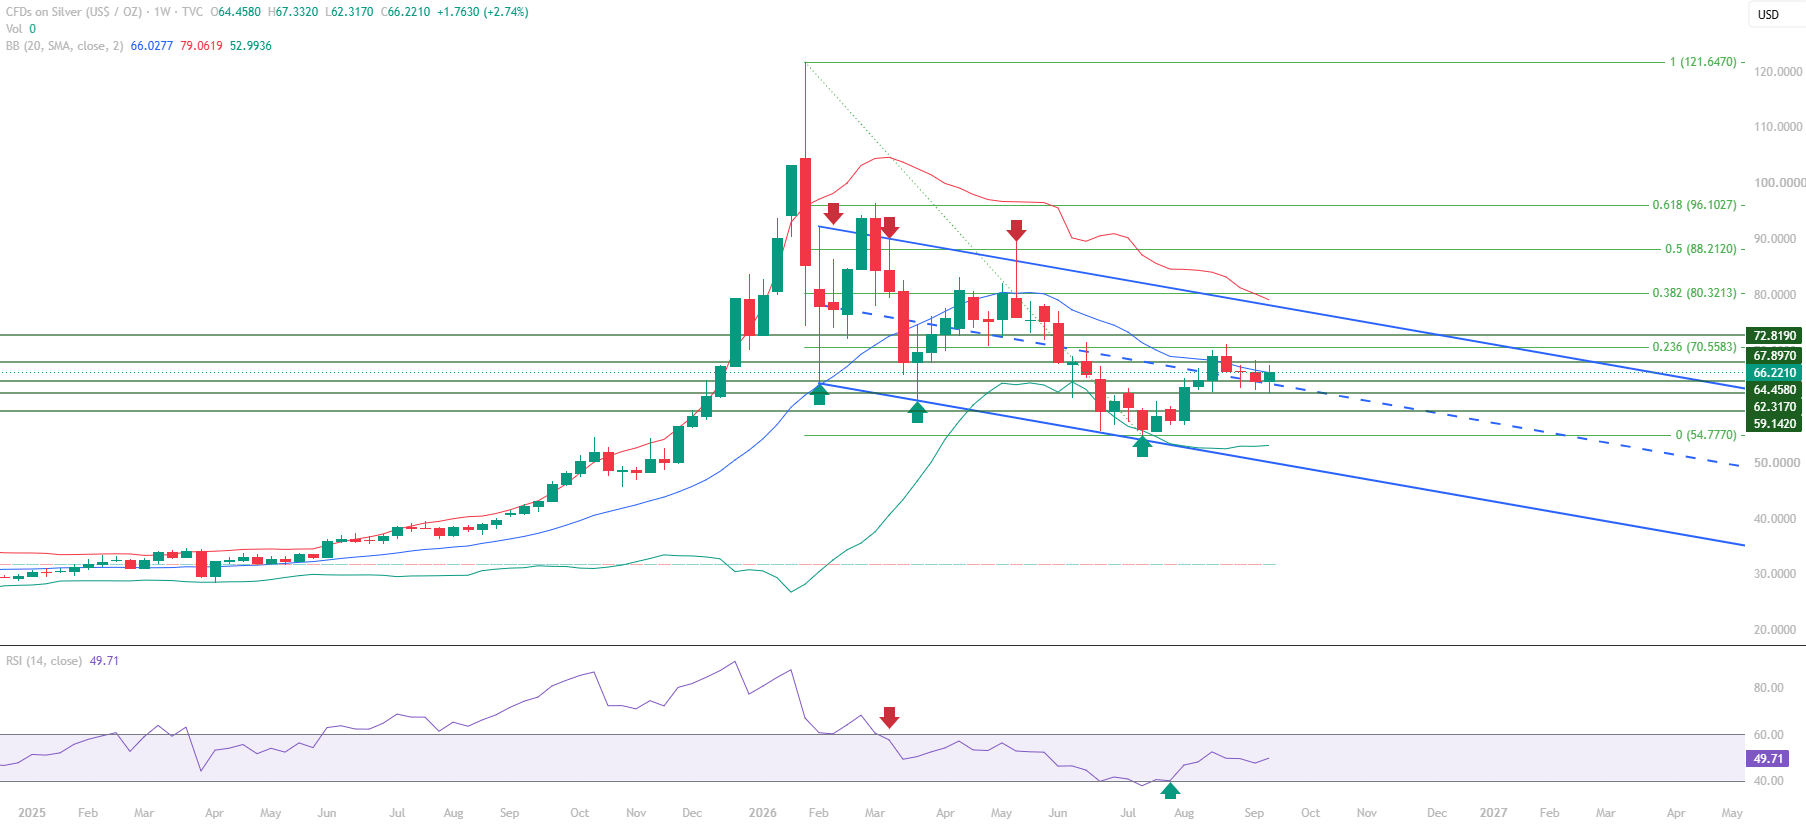
Silver today shows a bounce from the lower boundary of the downward-sloping trend channel, according to this educational technical chart analysis for 21 September – 25 September 2026. The weekly close of 66.2210 sits marginally above the Mid Bollinger Band at 66.0277, which indicates a short-term technical recovery within the broader downtrend rather than a confirmed change in direction.
RSI at 49.71 remains within the 40-60 range, suggesting consolidation rather than a confirmed trend reversal. A sustained weekly close above 70.5583, accompanied by RSI moving above 60, would provide stronger evidence of improving momentum and a potential structural shift, and that is the central question of this Silver chart analysis.
All content on this page is educational technical chart analysis provided for informational purposes only. It does not constitute investment advice or any recommendation to buy, sell, or hold any financial instrument.
What Does the Current Silver Chart Structure Show?
The weekly Silver (XAGUSD) chart shows a market trading within a downward-sloping trend channel that has been in place since February 2026. Price has bounced from the lower boundary of that channel, which indicates a short-term technical recovery, but the overall trend remains bearish because price continues to trade inside the channel formed at the start of the downtrend.
The weekly close of 66.2210 is only marginally above the Mid Bollinger Band at 66.0277, and price is trading above near-term support but below the key resistance levels. RSI has failed to sustain above 60, which points to bearish or consolidating momentum, and the formation of lower lows continues to reflect underlying weakness in the prevailing downtrend.
- Price is trading within the downward-sloping trend channel formed at the start of the downtrend
- Price has bounced from the lower boundary of the channel, indicating a short-term technical recovery
- RSI remains within the 40-60 consolidation range, and a sustained move above 60 would provide the first indication of improving momentum
- Price closed marginally above the Mid Bollinger Band at 66.0277, which may act as an immediate support zone in the near term
- Sentiment is a bearish phase with a technical bounce in place
Why the Bounce Has Not Yet Confirmed a Reversal
A bounce from the lower boundary of a channel is a common reaction point, but it does not by itself change the trend. Silver’s weekly close of 66.2210 sits only marginally above the Mid Bollinger Band at 66.0277 and remains below the key resistance levels, while RSI at 49.71 is still inside the 40-60 range. Together these readings describe consolidation within the downtrend rather than a confirmed momentum reversal.
This is why the levels matter more than the bounce itself. A sustained weekly close above 67.8970, followed by RSI moving above 60 and a breakout above 70.5583, would strengthen the case for improving momentum and a potential structural shift. Failure to hold 64.4580 could instead expose 62.3170 and then 59.1420, so the critical reaction zone of 64.4580 – 67.8970 remains the area that shapes the near-term picture.
How Are the Technical Indicators Reading?
RSI (Relative Strength Index)
RSI is at approximately 49.71 on the weekly chart and remains within the 40-60 range, indicating consolidation rather than a confirmed momentum reversal. RSI has failed to sustain above the 60 threshold, so a sustained move above 60 would be the first indication of improving momentum.
Bollinger Bands
Price has closed marginally above the Mid Bollinger Band at 66.0277, which may act as an immediate support zone in the near term. Because the close is only marginally above the band, the margin is thin, and the level serves as the first reference point for the short-term recovery.
Fibonacci Analysis
The Fibonacci retracement levels on the chart are 0 at 54.7770, 0.236 at 70.5583, 0.382 at 80.3213, 0.5 at 88.2120 and 0.618 at 96.1027. Of these, 0.236 at 70.5583 is the key resistance level, and it sits above the CMP of 66.2210 and has not been reached. The 0.382, 0.5 and 0.618 levels sit further above.
Trend Channel
Silver continues to trade within a downward-sloping trend channel formed since February 2026. Price has bounced from the lower boundary of the channel, indicating a short-term technical recovery within the broader downtrend.
Key Technical Levels for Silver (XAGUSD)
The following support and resistance levels are identified in this Silver educational technical chart analysis. All levels are derived from expert chart analysis using publicly available market data.
Resistance Levels
| Resistance Type | Price Level | Notes |
|---|---|---|
| Immediate Resistance | 67.8970 | Immediate resistance, sits above the CMP of 66.2210 |
| Key Resistance | 70.5583 | Fibonacci 0.236 |
| Major Resistance | 72.8190 | Major resistance level |
Support Levels
| Support Type | Price Level | Notes |
|---|---|---|
| Immediate Support | 66.0277 | Mid Bollinger Band |
| Key Support | 64.4580 | Key support level |
| Major Support | 62.3170 | Major support level |
| Secondary / Extended Support | 59.1420 | Secondary and extended support level |
Summary: Silver Technical Outlook
This Silver (XAGUSD) educational technical chart analysis for 21 September – 25 September 2026 describes a broader downtrend with a short-term technical bounce from the lower boundary of the downward-sloping trend channel. At a CMP of 66.2210, only marginally above the Mid Bollinger Band at 66.0277, and with RSI at 49.71 inside the 40-60 range, the silver today picture is one of consolidation rather than a confirmed reversal.
The critical reaction zone of 64.4580 – 67.8970 covers the key support region and the primary horizontal resistance area. The chart structure context reads as a technical bounce in the short term, consolidation in the medium term, and a broader downtrend in the long term. Risk factors cited in the analysis include geopolitical tensions, US Dollar movement and the global demand outlook.
- Broader downtrend remains intact, with price still trading inside the downward-sloping channel formed since February 2026
- A short-term technical bounce from the lower channel boundary is in place, with the close only marginally above the Mid Bollinger Band at 66.0277
- RSI at 49.71 remains in the 40-60 consolidation range, and a sustained move above 60 would be the first indication of improving momentum
- Immediate resistance at 67.8970 sits above price, with key resistance at 70.5583 (Fibonacci 0.236) as the next level
- A sustained weekly close above 67.8970, RSI above 60 and a breakout above 70.5583 would strengthen the case for a potential structural shift
- Failure to hold 64.4580 could expose 62.3170 and then 59.1420
Subscribe to Get Weekly Analysis in Your Inbox
Get weekly technical chart analysis on S&P 500, Gold, Silver, Brent Crude and Bitcoin delivered straight to your inbox.
Important Disclaimer
All content on Chartrick, including charts, analysis reports, articles, and educational materials, is provided for general informational and educational purposes only. Nothing on this platform constitutes investment advice, financial advice, trading advice, or any recommendation to buy, sell, or hold any financial instrument. Financial markets carry risk, and past chart analysis does not guarantee future performance. All analysis is based on publicly available market data and is subject to change at any time. While every effort is made to ensure accuracy, Chartrick does not accept liability for any loss, damage, or financial outcome arising directly or indirectly from use of or reliance on this content, including any errors or omissions in the analysis. Users are solely responsible for their own investment and trading decisions and should exercise their own independent judgment.