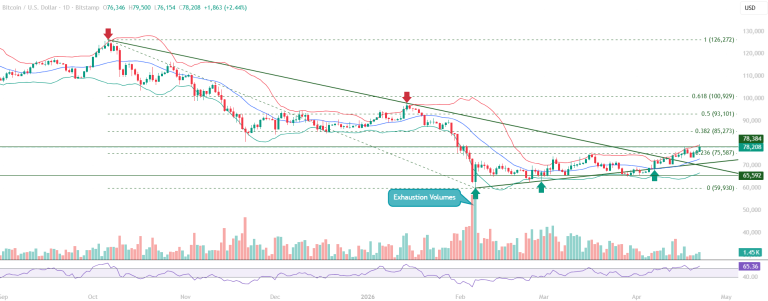
Bitcoin: Base Formation with Exhaustion Volume – Breakout on the Verge?
This Bitcoin chart analysis identifies the exhaustion volume signal from early February 2026 as the foundational context for the current structure.

This Bitcoin chart analysis identifies the exhaustion volume signal from early February 2026 as the foundational context for the current structure.
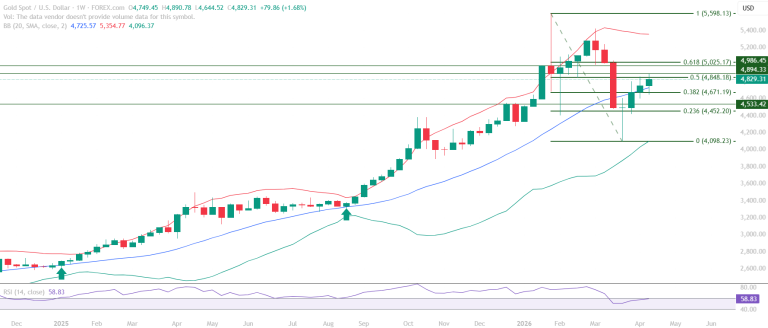
Gold weekly technical analysis for the week of April 20-24, 2026 identifies a market approaching a defining decision zone.
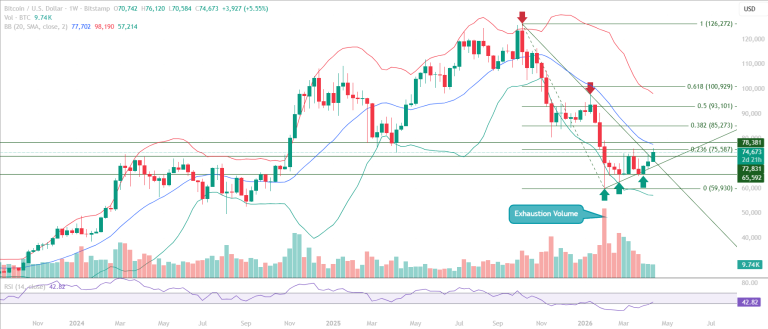
This Bitcoin chart analysis identifies the exhaustion volume signal from early February 2026 as the structural foundation for the current recovery.
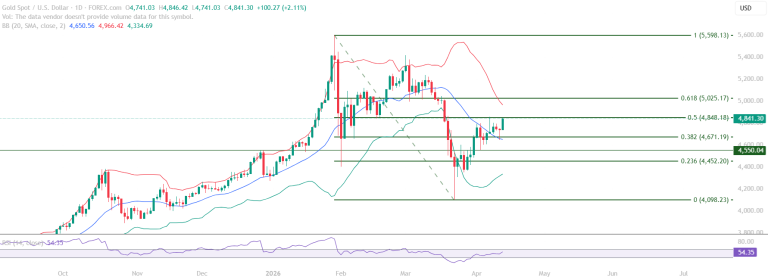
Gold chart analysis identifies a market in a defined bounce phase, approaching the Fibonacci 0.50 resistance at 4,848.18 with RSI at 54.35
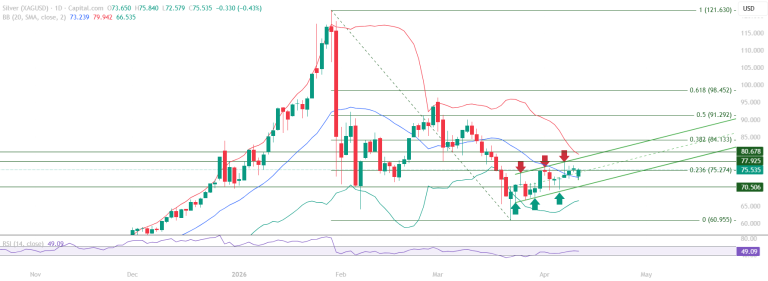
This Silver chart analysis examines the defining structural development: the 70.506 level has transitioned from a resistance zone to a support level.
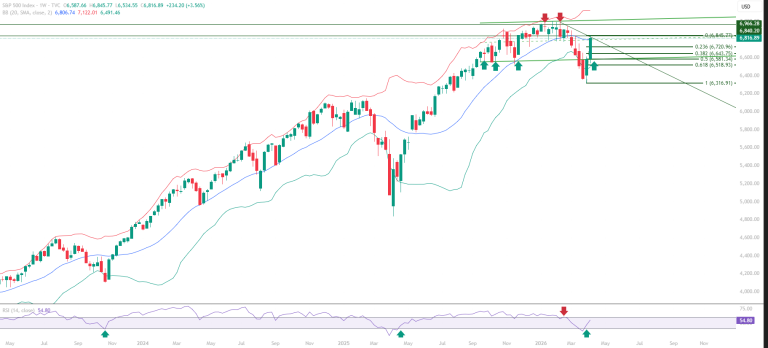
This S&P 500 chart analysis examines the quality of the recovery.The RSI has reclaimed the 40 level and is approaching the 60 threshold.





