S&P Today: Market Prediction, S&P 500 Technical Analysis & Key Levels
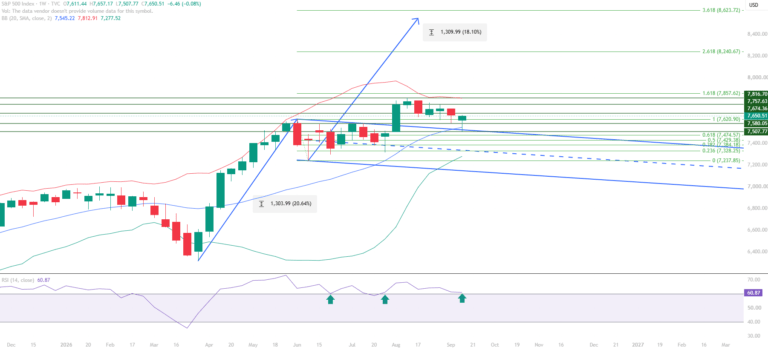
S&P Today: S&P 500 market prediction and weekly technical analysis covering RSI, bull-flag structure, support, resistance and key levels to watch.

S&P Today: S&P 500 market prediction and weekly technical analysis covering RSI, bull-flag structure, support, resistance and key levels to watch.
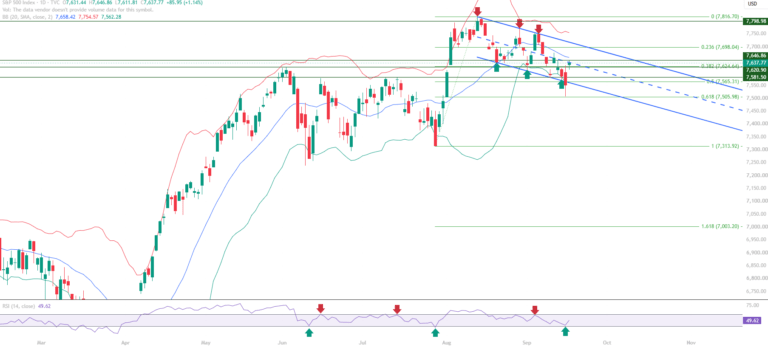
S&P Today: Review the S&P 500 market prediction, daily technical analysis, RSI momentum, support and resistance levels, and the broader market structure.
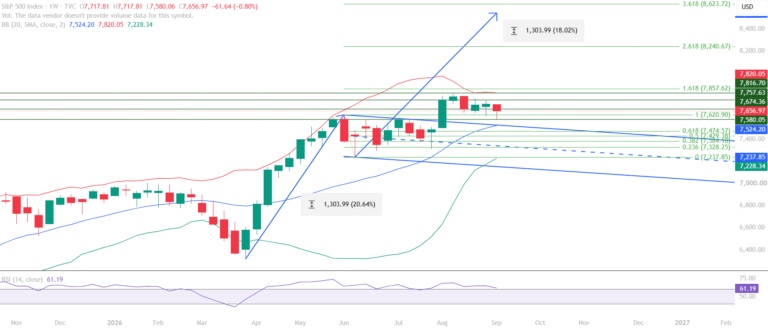
S&P 500 today: Review the weekly market prediction, bull flag setup, RSI momentum, support and resistance levels, and potential breakout or pullback zones
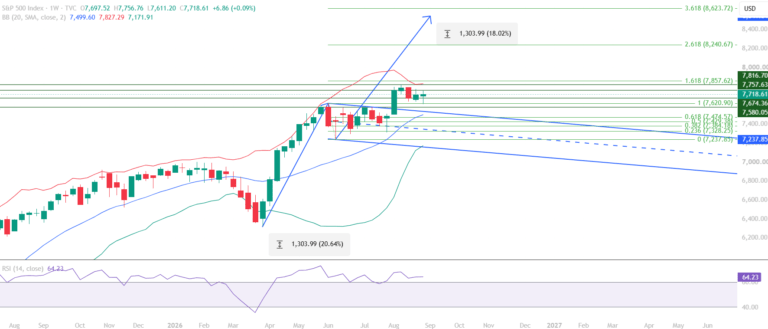
Chartrick 7 September, 2026 S&P 500 (SPX) | Published by Chartrick’s Team of Experienced Technical Analysts Week07 September – 11 September 2026 TypeWeekly Analysis CMP7,718.61 (as on 04 September 2026) OutlookStrong momentum within a broader uptrend Key Insight This S&P…
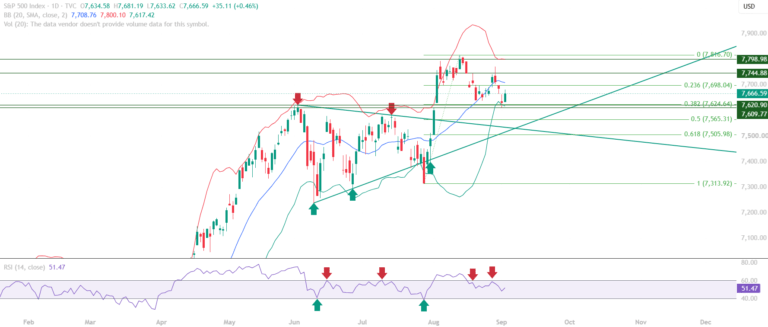
s&p 500 today is working through a consolidation phase after a strong multi-week rally carried price to a recent high near 7,798.98
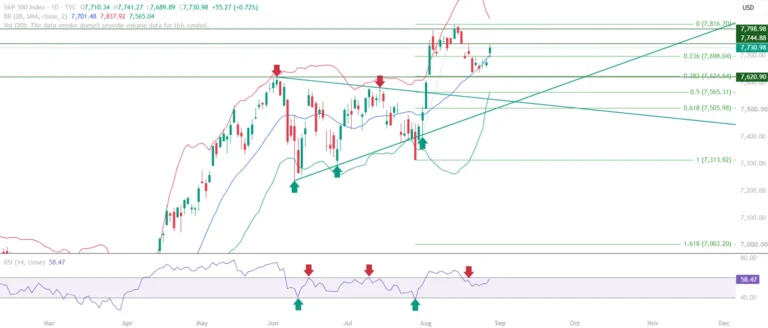
S&P 500 Index (SPX) examines a market that has moved from its recent rally into a consolidation phase.
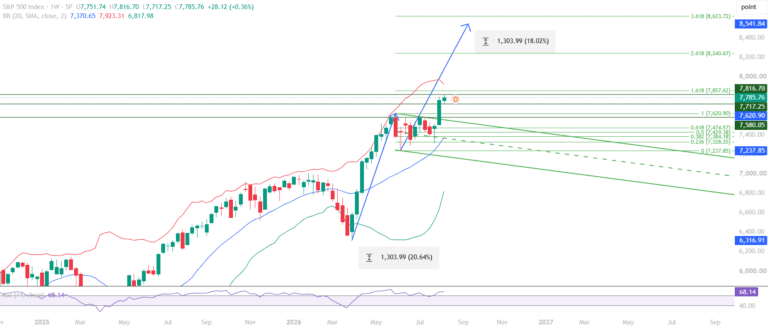
This S&P structure builds on a sharp rally that carried the index from 7313.92 to 7816.70, part of a broader uptrend defined by consistent higher highs and higher lows.
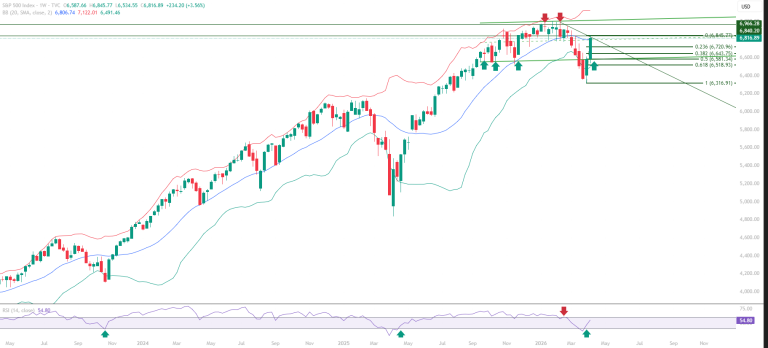
This S&P 500 chart analysis examines the quality of the recovery.The RSI has reclaimed the 40 level and is approaching the 60 threshold.
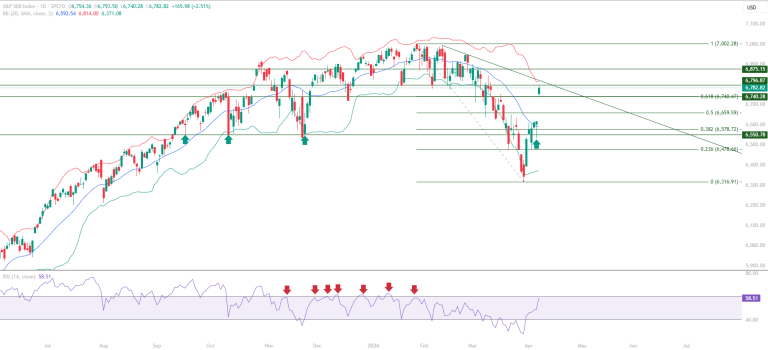
S&P 500 analysis identifies structural development: price has pushed decisively through the Fibonacci 0.618 retracement
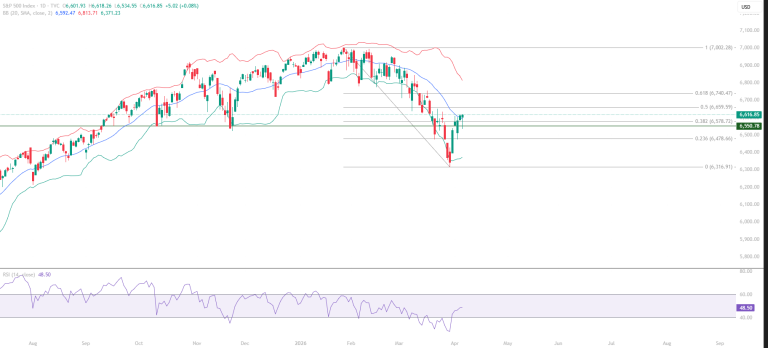
This S&P 500 chart analysis identifies the 6,659.59 Fibonacci 0.50 as the primary resistance test ahead.





