

23
MarchRSI Indicator Explained: How to Use RSI for Accurate Trade Signals
By chartrickadmin, In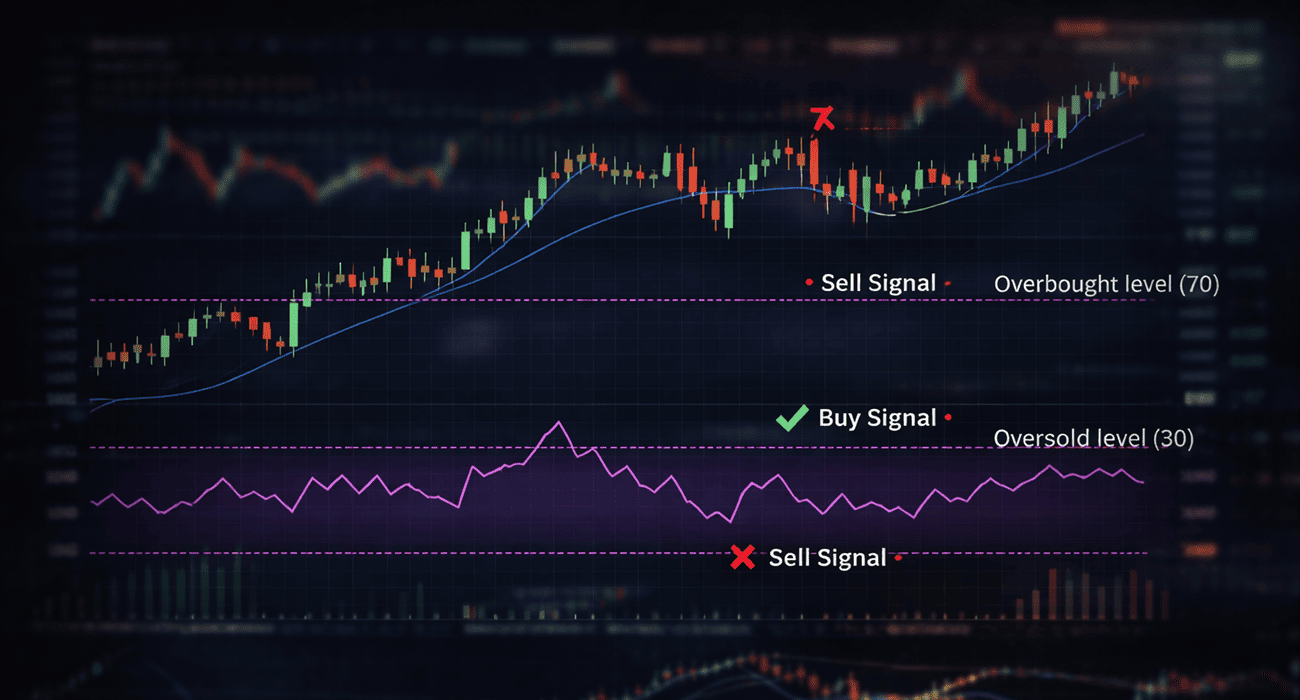
Introduction The RSI (Relative Strength Index) is one of the most powerful momentum indicators used in technical analysis. It helps traders identify potential reversals and trend strength. What is RSI Indicator? RSI measures the speed and change of price movements on a scale of 0 to 100. RSI Formula &…
Read More23
MarchUnderstanding Market Structure: Trends, Cycles, and Market Outlook
By chartrickadmin, In
Introduction Market structure is the backbone of technical analysis. By understanding market trends and cycles, traders can align their strategies with the broader market direction. What is Market Structure? Market structure refers to how price moves in: Uptrends Downtrends Sideways markets Types of Market Trends Uptrend (Bullish Market) Higher highs…
Read More23
MarchHow to Read Stock Charts: A Beginner’s Guide to Technical Analysis
By chartrickadmin, In
Introduction If you're new to trading or investing, understanding how to read stock charts is the first step toward making informed decisions. Technical analysis helps traders predict price movements based on historical data, patterns, and indicators. What is Technical Analysis? Technical analysis is the study of price movements using charts,…
Read More