
Market Overview
Today’s crude oil technical analysis examines the strongest chart structure among the assets covered in this session. Brent Crude Oil (UKOIL) has reclaimed its uptrend trendline with RSI moving above the 60 level, indicating strengthening bullish momentum. This educational technical chart analysis explores the consolidation at the top within a broader uptrend and what it means for the near-term outlook.
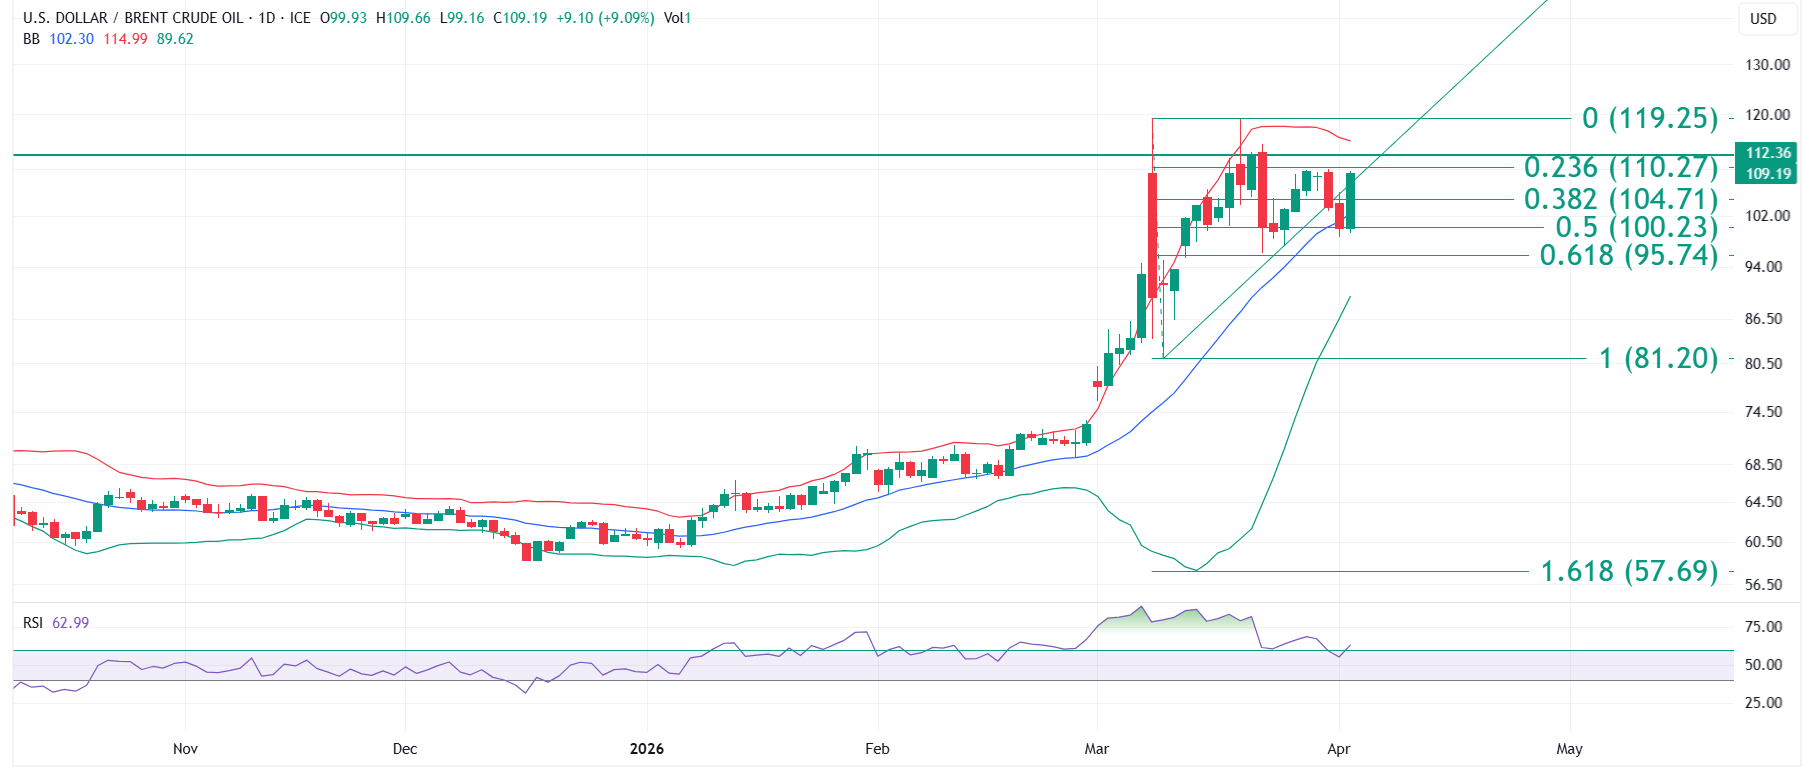
The oil market analysis reveals a vertical rally from the 80 zone to 119+, followed by a consolidation phase. Price has sharply rebounded from the 100 psychological level, closing decisively above the Mid Bollinger Band near 102.30. The UKOIL chart analysis identifies this as a bullish structure gaining momentum.
Chart Analysis
The daily candlestick chart for Brent Crude Oil (UKOIL) shows consolidation at the top within a broader uptrend, a structural pattern that is materially different from the recovery phases observed in equities and precious metals. The combination of trendline reclaim, RSI above 60, and price above the Mid Bollinger Band creates a three-factor bullish confluence.
The Brent crude oil price outlook is defined by the approach to the 110 resistance zone. The 104.71 level (Fibonacci 0.382) may transition from resistance to support, while the uptrend trendline provides dynamic support. This energy market technical analysis identifies the 102.30 to 104.71 zone as the critical support range that must hold for the bullish structure to remain intact.
Technical Indicators
RSI Analysis: The Relative Strength Index has moved above the 60 level, which historically signals strengthening bullish momentum in trending markets. This is notably different from the other assets covered today, where RSI is operating around the 40 level. The RSI above 60 suggests that Brent Crude is in a stronger position on the momentum spectrum.
Bollinger Bands: Price has closed decisively above the Mid Bollinger Band near 102.30, which may now act as a dynamic support zone. This educational technical chart analysis notes that the transition of the Mid Bollinger Band from resistance to support is a constructive development for the near-term crude oil technical analysis outlook.
Key Technical Levels
| Level Type | Price Level | Notes |
| Strong Resistance | 119.25 | Fibonacci 0 level; major resistance zone |
| Key Resistance | 112.36 | Highest closing level in current uptrend |
| Immediate Resistance | 110.27 | Fibonacci 0.236 retracement level |
| Immediate Support | 104.71 | Fibonacci 0.382; potential resistance-to-support flip |
| Key Support | 102.30 | Mid Bollinger Band; dynamic support zone |
| Strong Support | 95.74 | Fibonacci 0.618 retracement level |
Summary
This Brent Crude Oil (UKOIL) educational technical chart analysis identifies a bullish structure with consolidation at the top and strengthening momentum. RSI above 60, trendline reclaim, and price above the Mid Bollinger Band create a three-factor bullish confluence. The broader uptrend from 80 remains firmly in place, and the market may witness either further upward continuation or consolidation near the 110 resistance zone. This educational technical chart analysis is designed to support informed decision-making.
Disclaimer: All content on Chartrick, including charts, analysis reports, articles, and educational materials, is provided for general informational and educational purposes only. Nothing on this platform constitutes investment advice, financial advice, trading advice, or any recommendation to buy, sell, or hold any financial instrument. Financial markets carry risk, and past chart analysis does not guarantee future performance. Chartrick will not accept liability for any loss or damage arising from use of or reliance on this content. Users are solely responsible for their own investment decisions.
Want expert educational technical chart analysis for a specific asset? Get Custom Chart Analysis at chartrick.com/custom-chart-analysis