
Market Overview
Today’s gold technical analysis examines a sharp recovery phase in Gold (XAUUSD) that is approaching a significant resistance confluence zone. This educational technical chart analysis covers the rally from the 4,100 zone to nearly 4,800, with price now testing the convergence of the Mid Bollinger Band and a downward sloping trendline from January 2026 highs.
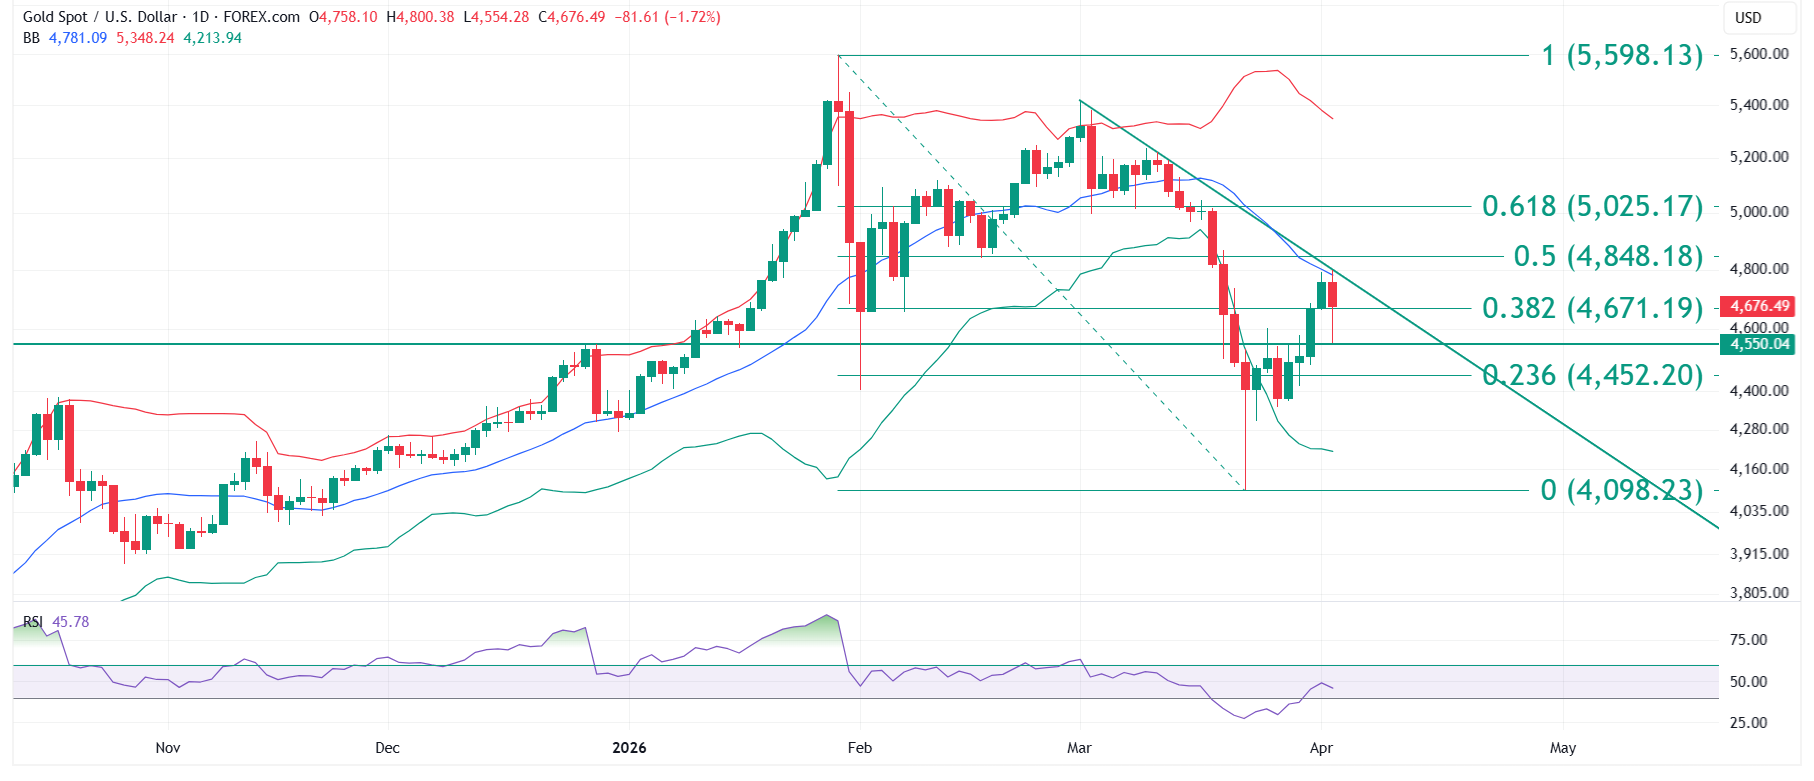
The gold market analysis reveals a recovery phase supported by improving momentum and buying pressure. Price has reclaimed the 0.382 Fibonacci level at 4,671.19 and closed above the key 4,550 psychological level, indicating accumulation at lower levels and improving short-term strength within the broader corrective structure.
Chart Analysis
The daily candlestick chart for Gold (XAUUSD) shows a bounce phase within a broader corrective structure. The sharp rally from 4,100 to 4,800 demonstrates strong buying interest from the base level. The XAUUSD chart analysis reveals that the 4,550 level, which previously acted as a key pivot, is now functioning as support, a classic resistance-to-support transition.
The gold price technical outlook is defined by the approaching test of the 4,800 zone. This is where the Mid Bollinger Band converges with the downward sloping trendline drawn from the January highs, creating a dual resistance confluence. This educational technical chart analysis identifies this zone as the key decision point for gold’s near-term direction.
Technical Indicators
RSI Analysis: The Relative Strength Index has moved above the 40 level, which is now acting as a momentum support zone. Sustaining above RSI 40 indicates bullish momentum retention, while a breakdown below this level may signal weakening trend strength and potential downside.
Bollinger Bands: Price is approaching the Mid Bollinger Band near 4,800. The convergence of this dynamic resistance with the downward sloping trendline creates a dual resistance zone that will determine whether the recovery extends or encounters rejection. This educational technical chart analysis emphasizes the importance of monitoring price behavior at this confluence.
Key Technical Levels
| Level Type | Price Level | Notes |
| Major Resistance | 5,025.17 | Fibonacci 0.618 retracement level |
| Key Resistance | 4,848.18 | Fibonacci 0.50 retracement level |
| Major Resistance | 4,800 | Mid Bollinger Band + downward sloping trendline |
| Immediate Support | 4,671.19 | Fibonacci 0.382 retracement level |
| Key Support | 4,550 | Major psychological and structural support |
| Strong Support | 4,452.20 | Fibonacci 0.236 retracement level |
Summary
This gold (XAUUSD) educational technical chart analysis identifies a recovery phase with improving momentum indicators approaching a critical resistance confluence at 4,800. The broader uptrend from 4,100 levels remains intact, and the current corrective phase reflects consolidation with accumulation at lower levels. Market behavior at the Mid Bollinger Band and trendline confluence will determine the next structural move. This educational technical chart analysis is designed to support informed decision-making.
Disclaimer: All content on Chartrick, including charts, analysis reports, articles, and educational materials, is provided for general informational and educational purposes only. Nothing on this platform constitutes investment advice, financial advice, trading advice, or any recommendation to buy, sell, or hold any financial instrument. Financial markets carry risk, and past chart analysis does not guarantee future performance. Chartrick will not accept liability for any loss or damage arising from use of or reliance on this content. Users are solely responsible for their own investment decisions.
Want expert educational technical chart analysis for a specific asset? Get Custom Chart Analysis at chartrick.com/custom-chart-analysis