Support and resistance levels are among the most fundamental and widely referenced concepts in technical chart analysis. They appear in every Chartrick analysis published across S&P 500 (SPX), Gold (XAUUSD), Silver (XAGUSD), Brent Crude Oil, and Bitcoin (BTC) – and for good reason. These levels represent the price zones where markets have historically demonstrated a tendency to react, making them among the most analytically significant data points on any financial chart.
Yet despite their central role in educational technical chart analysis, support and resistance levels are frequently misunderstood. This guide explains what support and resistance levels are, why they form, how they are identified, and how Chartrick’s team of experienced technical analysts applies them in daily structured market analysis.
All content in this guide is educational technical chart analysis provided for informational purposes only. It does not constitute investment advice or any recommendation to buy, sell, or hold any financial instrument.
What Are Support Levels?
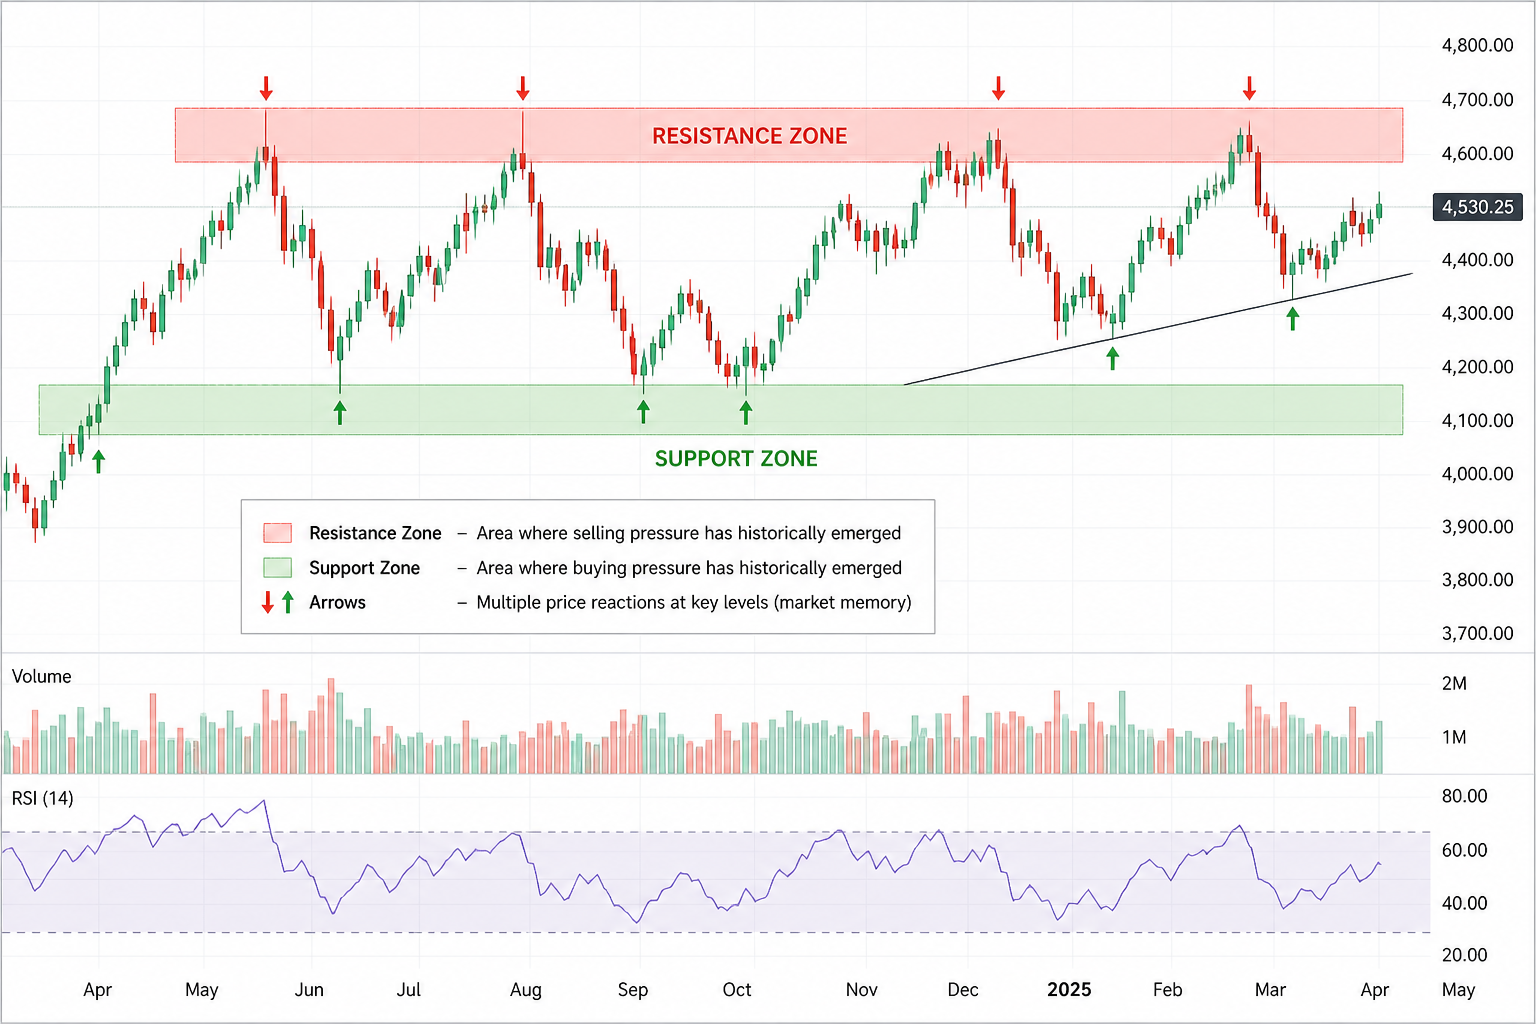
A support level is a price zone on a chart where buying interest has historically been sufficient to halt or reverse a price decline. When price approaches a support level, the market is entering a zone where, based on prior price history, demand has previously emerged and overwhelmed selling pressure.
Support levels do not guarantee that price will reverse or stabilise at any given zone. They identify where the chart’s historical record shows that the market has previously found a technical floor – a price area of potential significance. Whether that significance holds on any given approach depends on the current market conditions, the strength of the prevailing trend, and the behaviour of other technical elements at that same level.
In Chartrick’s daily structured market analysis, support levels are listed with specific price values in the Key Technical Levels section, categorised as immediate support, key support, and major support.
What Are Resistance Levels?
A resistance level is a price zone on a chart where selling pressure has historically been sufficient to halt or reverse a price advance. When price approaches a resistance level, the market is entering a zone where, based on prior price history, supply has previously emerged and overpowered buying pressure.
As with support, resistance levels do not guarantee that price will reverse at any given zone. They identify where the chart’s historical record shows that the market has previously encountered a technical ceiling. The analytical significance of any resistance level must always be assessed in the context of the current trend structure and other technical indicators.
In Chartrick’s daily analysis, resistance levels are similarly categorised – immediate resistance, key resistance, and major resistance – each with specific price values.
Why Do Support and Resistance Levels Form?
Support and resistance levels form for several interconnected reasons rooted in market participant behaviour. Understanding why they form is as important as knowing how to identify them.
Market Memory
Financial markets have memory. Price levels where significant reactions have previously occurred are remembered by market participants – both institutional and retail. When price returns to a level where a major reversal previously occurred, the market’s collective memory of that event influences how participants behave at that zone again.
This is why a level that produced a sharp reversal three months ago can remain analytically relevant when price returns to that same zone. The technical significance of a level does not expire – it persists as long as that price zone remains within the market’s tradeable history.
Prior Swing Highs and Lows
Among the most reliable sources of support and resistance levels are prior swing highs and swing lows – the turning points where price reversed direction on previous occasions.
- A prior swing high represents a level where sellers previously overwhelmed buyers, making it a candidate resistance level on any subsequent approach
- A prior swing low represents a level where buyers previously absorbed selling pressure, making it a candidate support level
- The more significant the prior swing – the sharper the reversal, the higher the volume – the greater the analytical weight assigned to that level
Fibonacci Retracement Levels
Fibonacci retracement levels are among the most widely used tools for identifying potential support and resistance zones. Derived from the Fibonacci sequence, the primary retracement levels – 0.236, 0.382, 0.500, 0.618, and 0.786 – are applied by drawing a Fibonacci grid from a significant swing low to a significant swing high (or vice versa).
The resulting price levels frequently correspond to zones where retracements pause or reverse. Chartrick’s daily structured market analysis includes Fibonacci levels as named, specifically-valued key technical levels in every analysis. References to levels such as the Fibonacci 0.382 retracement or the Fibonacci 0.618 retracement appear regularly with precise price coordinates.
Dynamic Levels: Moving Averages and Bollinger Bands
Not all support and resistance levels are static price points on a chart. Dynamic levels move continuously as price evolves, recalculating based on recent price data.
- The 20-period moving average (middle Bollinger Band) is a widely observed dynamic level that frequently acts as support in uptrending markets and resistance in downtrending markets
- The 50-period and 200-period moving averages often serve as dynamic support and resistance levels over longer timeframes
- Dynamic levels carry particular significance because they respond to current price conditions rather than anchoring to a fixed historical price point
In Chartrick’s daily educational technical chart analysis, the middle Bollinger Band is identified as a key level with a specific price value, reflecting its role as a dynamic support or resistance reference depending on the current trend structure.
Psychological Round Numbers
Round numbers – such as 5,000 on the S&P 500, 3,000 on Gold (XAUUSD), or 100,000 on Bitcoin (BTC) – carry inherent psychological significance in financial markets. They attract attention from a broad cross-section of market participants, making them natural clusters for order placement and price reaction. Chartrick’s analysts account for the proximity of round numbers when assessing the significance of nearby technical price zones.
Role Reversal: When Support Becomes Resistance
One of the most important concepts in support and resistance analysis is role reversal. When a support level is decisively broken to the downside, that former support level frequently transforms into a resistance level on any subsequent upward retest of that price zone.
The same principle applies in reverse: when a resistance level is decisively broken to the upside, that former resistance zone frequently converts into support on any subsequent pullback.
This role reversal phenomenon reflects the market’s memory in action. Participants who held positions at a level that subsequently broke often use any return to that level as an opportunity to exit – creating supply that reinforces its new role as resistance. The strength of a role reversal tends to be proportional to the significance of the original level and the decisiveness of the break.
Role reversal is one of the most practically significant concepts in support and resistance analysis. Chartrick’s analysts flag role reversal conditions explicitly when a key level has been broken and is subsequently being retested from the other side.
How Support and Resistance Levels Are Used in Chart Analysis
Understanding how support and resistance levels are used in educational technical chart analysis requires clarity about what their purpose actually is. They are not signals to act. They are contextual reference points – technically significant zones that define the analytical landscape of the chart.
A support level below current price tells an analyst where the chart’s historical record suggests that price has found demand. A resistance level above current price tells an analyst where the chart’s historical record suggests that supply has emerged. Together, these levels create a structured technical map of the market’s significant price zones.
How a market behaves when it approaches these zones – including what RSI momentum is doing, what volume signals are present, and what the broader trend structure indicates – determines the analytical interpretation of any given level at any given time. No level should be interpreted in isolation.
Levels vs. Lines: Why Precision Matters
A common misconception in technical chart analysis is treating support and resistance as thin lines on a chart. In practice, these are zones – price areas of varying width that reflect the natural imprecision of market behaviour. Price rarely turns at an exact tick.
However, precision still matters in how levels are identified and communicated. Chartrick’s daily structured market analysis lists each key technical level with a specific price value because the difference between support at 3,245 and support at 3,250 is analytically meaningful – particularly for markets where intraday ranges are narrow. Approximate or vague level identification reduces the utility of the analysis.
See Key Technical Levels Identified Daily
Chartrick’s expert analysts publish specific support and resistance levels for S&P 500, Gold (XAUUSD), Silver (XAGUSD), Brent Crude Oil, and Bitcoin (BTC) in every daily structured market analysis.
Support and Resistance Across Chartrick’s Core Markets
The character of support and resistance behaviour varies meaningfully across different asset classes. Chartrick’s daily educational technical chart analysis applies the same rigorous framework across all five core markets while accounting for the specific technical characteristics of each:
- S&P 500 (SPX) – key technical levels include major Fibonacci retracement zones from prior cycle highs and lows, the middle Bollinger Band as a dynamic level, and prior consolidation boundaries
- Gold (XAUUSD) – key levels are derived from long-term trend structure, including multi-year Fibonacci extension levels and historically significant price zones that have produced major reversals
- Silver (XAGUSD) – support and resistance levels often show sharper reactions than Gold at equivalent structural zones, reflecting the asset’s higher volatility characteristics
- Brent Crude Oil – key technical levels frequently coincide with Fibonacci retracement levels from major price swings and prior consolidation range boundaries
- Bitcoin (BTC) – technically significant levels include prior cycle highs and lows, Fibonacci retracement and extension levels, and round number psychological levels
Key Takeaways: What Are Support and Resistance Levels?
- Support levels are price zones where buying interest has historically halted or reversed price declines
- Resistance levels are price zones where selling pressure has historically halted or reversed price advances
- Key sources include prior swing highs and lows, Fibonacci retracement levels, dynamic moving averages, and psychological round numbers
- Role reversal occurs when a broken support level converts to resistance, and a broken resistance level converts to support
- Support and resistance levels are contextual reference points for chart analysis – not automatic action triggers
- Chartrick identifies key technical levels with specific price values in every daily structured market analysis
Want Expert Chart Analysis With Key Levels Identified?
Request educational technical chart analysis, for any Equities, Commodity, or Cryptocurrency and Indices delivered within 2 working days.
Decoding the Language of Charts.
Important Disclaimer
All content on Chartrick, including charts, analysis reports, articles, and educational materials, is provided for general informational and educational purposes only. Nothing on this platform constitutes investment advice, financial advice, trading advice, or any recommendation to buy, sell, or hold any financial instrument. Financial markets carry risk, and past chart analysis does not guarantee future performance. All analysis is based on publicly available market data and is subject to change at any time. While every effort is made to ensure accuracy, Chartrick does not accept liability for any loss, damage, or financial outcome arising directly or indirectly from use of or reliance on this content, including any errors or omissions in the analysis. Users are solely responsible for their own investment and trading decisions and should exercise their own independent judgment.