
Market Overview
Today’s silver technical analysis highlights a significant structural development in Silver (XAG): the 70.506 level has completed a transition from resistance to support. This educational technical chart analysis examines how this structural shift, combined with improving RSI momentum above 40, positions silver for a test of the Mid Bollinger Band and trendline confluence near 76.406.
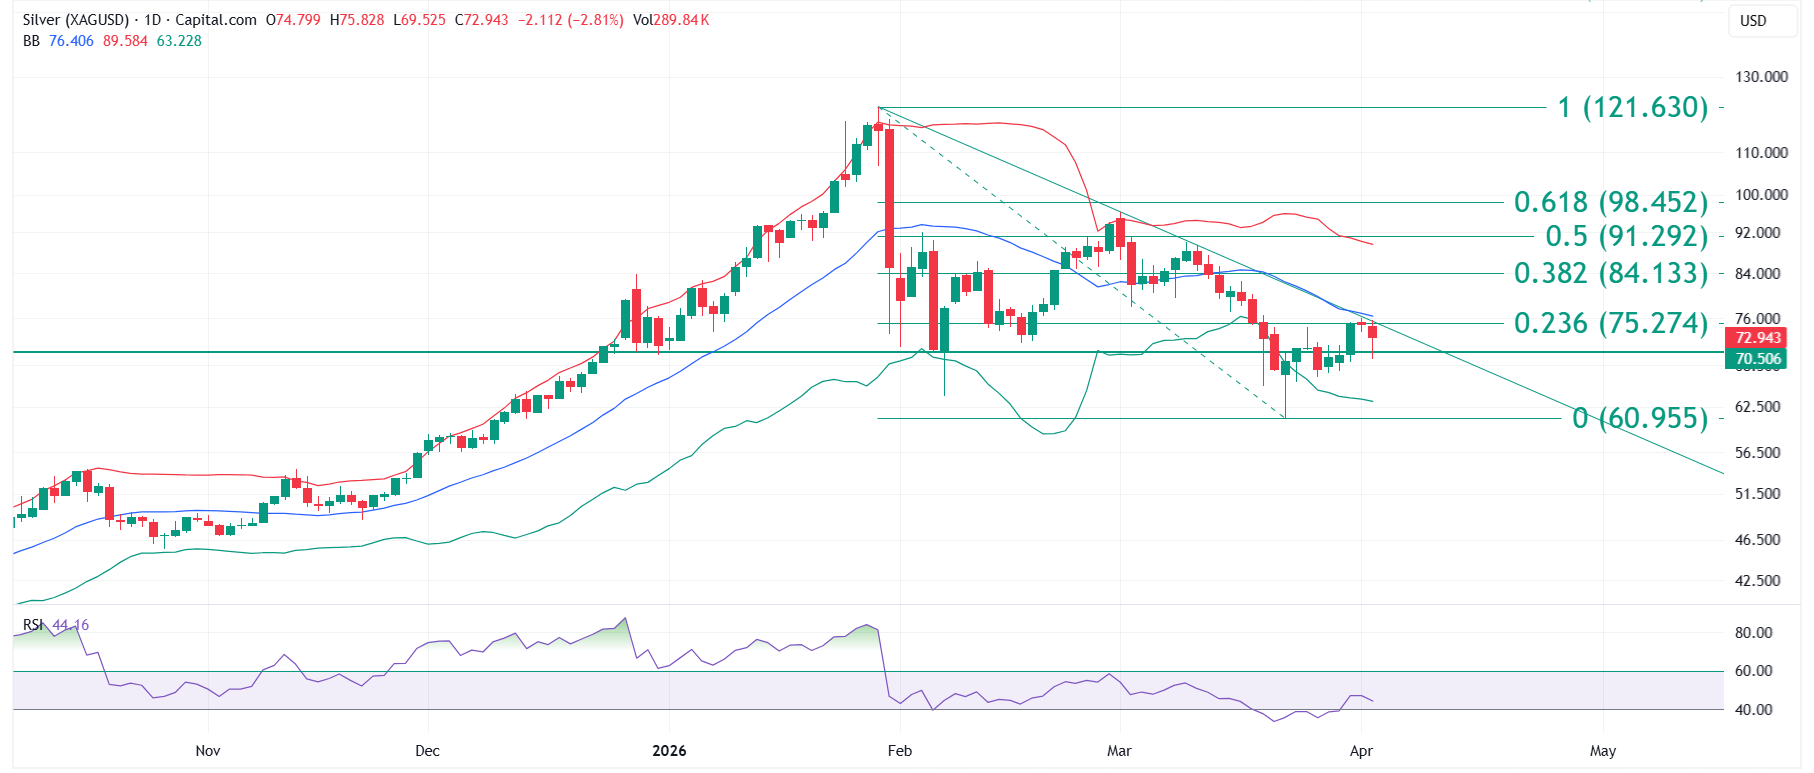
The silver market analysis reveals a recovery phase from the 60.955 base, with the rally to 76.107 demonstrating strong buying interest. The XAG chart analysis focuses on the approaching dual resistance confluence that will determine the next directional move.
Chart Analysis
The daily candlestick chart for Silver (XAG) shows a bounce phase within a broader corrective structure. The most notable technical development is the resistance-to-support flip at 70.506. This level previously acted as resistance and has now been retested as support, with buyers stepping in at this zone. This type of structural shift is a classic technical confirmation pattern.
The silver price support and resistance levels analysis reveals that the 70 to 77 zone defines the current trading range. The Fibonacci retracement from the recent move shows levels extending significantly higher, with 0.382 at 84.133, suggesting substantial room for upside if the resistance confluence at 76.406 is cleared.
Technical Indicators
RSI Analysis: The Relative Strength Index has retested the 40 level and is holding above it, suggesting bullish momentum retention. The RSI pattern mirrors the recovery structure visible in the price chart, with improving momentum supporting the structural shift at 70.506.
Bollinger Bands: The Mid Bollinger Band at 76.406 aligns with the downward sloping trendline, creating a dual resistance confluence. This educational technical chart analysis identifies this zone as the critical barrier for silver’s recovery to extend. A breakout above this level would signal a potential structural trend change.
Key Technical Levels
| Level Type | Price Level | Notes |
| Major Resistance | 76.406 | Mid Bollinger Band + downward sloping trendline |
| Immediate Resistance | 75.274 | Fibonacci 0.236 retracement level |
| Immediate Strong Support | 70.506 | Former resistance now acting as support |
| Major Support | 60.955 | Fibonacci 0 level; long-term base |
Summary
This silver (XAG) educational technical chart analysis identifies a structural shift at the 70.506 level, transitioning from resistance to support. The approaching test of the 76.406 dual resistance confluence will determine whether the recovery extends towards 84.133 or encounters rejection. The broader uptrend from 60.955 remains intact. This educational technical chart analysis is designed to support informed decision-making.
Disclaimer: All content on Chartrick, including charts, analysis reports, articles, and educational materials, is provided for general informational and educational purposes only. Nothing on this platform constitutes investment advice, financial advice, trading advice, or any recommendation to buy, sell, or hold any financial instrument. Financial markets carry risk, and past chart analysis does not guarantee future performance. Chartrick will not accept liability for any loss or damage arising from use of or reliance on this content. Users are solely responsible for their own investment decisions.
Want expert educational technical chart analysis for a specific asset? Get Custom Chart Analysis at chartrick.com/custom-chart-analysis