
S&P 500 (SPX) | Published by Chartrick’s Team of Experienced Technical Analysts
Key Insight
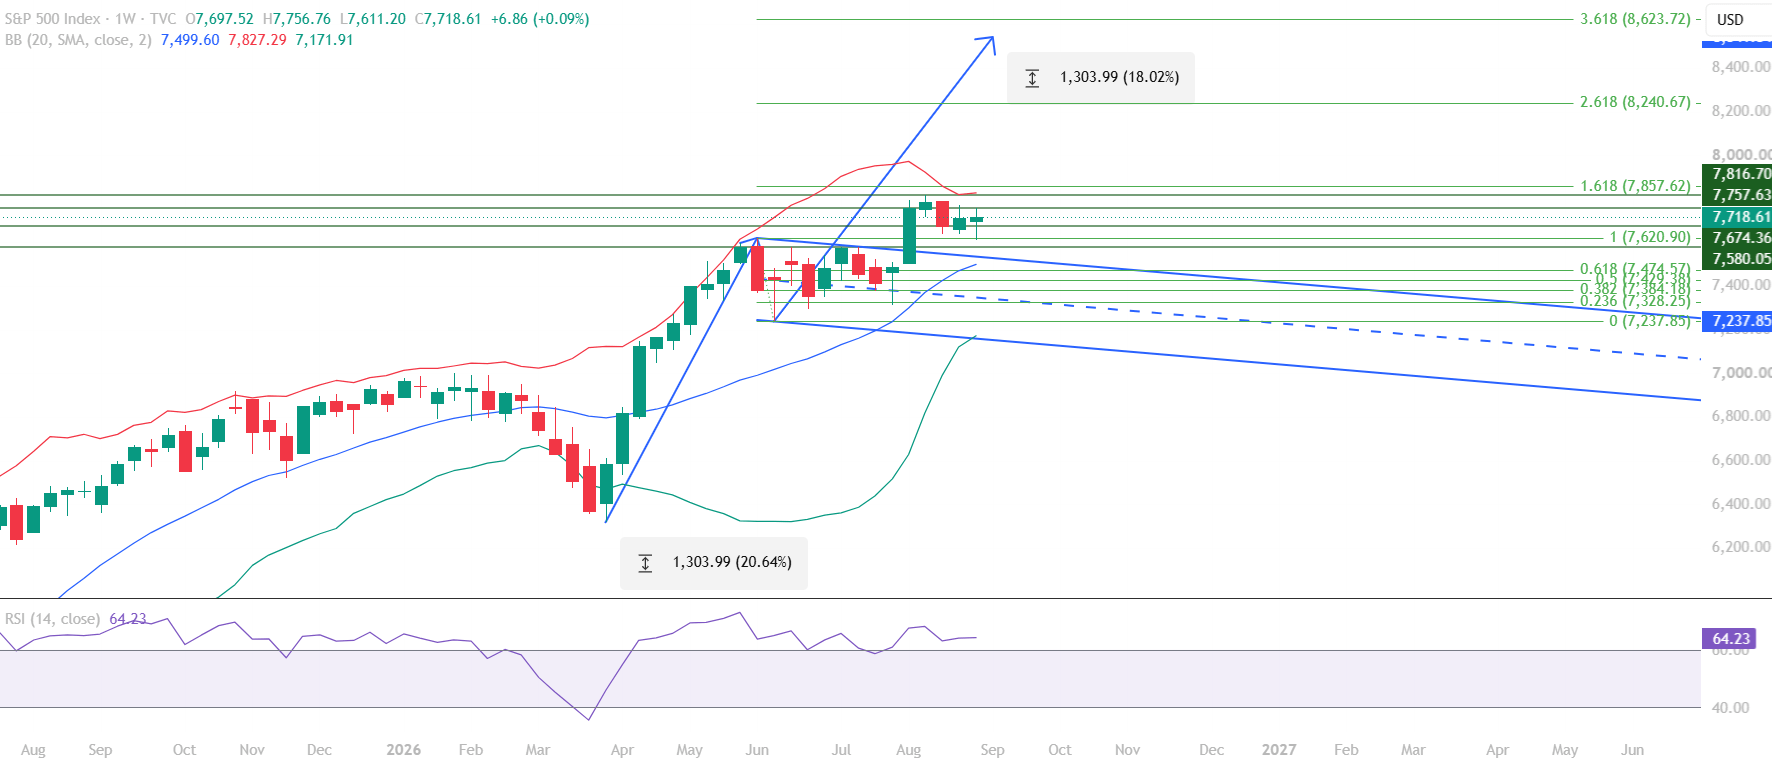
This S&P 500 (SPX) educational technical chart analysis for the week of September 7 to 11, 2026 examines an index trading near record highs following a sharp advance and a subsequent period of consolidation. A potential bull flag continuation pattern is developing on the weekly chart, and RSI holding repeatedly above the 60 level continues to reinforce the broader bullish structure. Price has also taken support from what was previously key resistance at 7,620.90, creating a notable Change-of-Polarity support zone beneath current levels.
The foundational context for this structure is the sharp rally that carried the index from 7,313.92 to 7,816.70. That advance left the index consolidating just beneath its recent high, with the 7,620.90 level – the prior resistance that capped the rally – now acting as a support shelf on pullbacks. This transition from resistance to support is what technical analysts describe as a Change-of-Polarity, and it forms the backbone of the current weekly outlook.
All content on this page is educational technical chart analysis provided for informational purposes only. It does not constitute investment advice or any recommendation to buy, sell, or hold any financial instrument.
What Does the Current S&P 500 Chart Structure Show?
The weekly S&P 500 (SPX) chart reflects an index that remains within a strong uptrend, trading near record highs while consolidating just below the 7,816.70 swing high. This consolidation is taking the shape of a potential bull flag continuation pattern, with price compressing into a narrower range following the sharp move higher. Higher highs and higher lows across recent weeks continue to reinforce the broader uptrend structure.
The 7,620.90 level is central to this structure. Having previously acted as a resistance ceiling during the rally, price has since taken support from this level, marking a Change-of-Polarity zone that now underpins the consolidation. As long as this zone holds, the broader structural bias remains constructive; a break beneath it would be an early signal that the consolidation is turning into a deeper pullback rather than a continuation setup.
- Sharp rally from 7,313.92 to 7,816.70 forms the base of the current structure
- Price consolidating near record highs beneath the 7,816.70 swing high
- 7,620.90 has transitioned from resistance to a Change-of-Polarity support zone
- Bull flag continuation pattern developing within the broader uptrend
- Higher highs and higher lows continue to define the medium-term structure
The Change-of-Polarity Support at 7,620.90
The Change-of-Polarity zone at 7,620.90 is the single most important structural signal in this week’s S&P 500 chart analysis. This level previously acted as a resistance ceiling during the rally phase, and price now finding support at the same level is a classic technical pattern where old resistance converts into new support once broken and retested. Markets often reveal their next directional bias at exactly this kind of level, which is why its continued hold matters more than any single day’s price action. A sustained hold above 7,620.90 keeps the bull flag continuation setup intact, while a decisive break below it would call the near-term structure into question.
How Are the S&P 500 Technical Indicators Reading?
This S&P 500 educational technical chart analysis draws on RSI, Bollinger Bands, and Fibonacci retracement levels applied to the weekly candlestick chart, alongside the trend channel formed by the current rally. Together these tools describe an index with strengthening momentum that remains contained within a well-defined structural range.
RSI, the Mid Bollinger Band, and the Fibonacci retracement grid all point to the same broad conclusion: momentum remains firmly in bullish territory even as price consolidates. The trend channel that has formed since the rally began adds a visual confirmation of the bull flag pattern already identified in the structural section above.
RSI (Relative Strength Index)
- RSI currently sits at 64.23 after repeatedly retesting and holding above the 60 level on multiple occasions
- Sustaining above 60 continues to support the broader bullish structure, and this level may now act as a key momentum support zone in its own right
Bollinger Bands
- Price remains well above the Mid Bollinger Band at 7,499.60, which continues to act as a dynamic support level beneath current price
Fibonacci Analysis
- 0 – 7,237.85
- 0.236 – 7,328.25
- 0.382 – 7,384.18
- 0.5 – 7,429.38
- 0.618 – 7,474.57
- 1 – 7,620.90
- 1.618 – 7,857.62
Trend Channel
- An upward-sloping trend channel has formed since the rally began and continues to contain price action
- The current consolidation is tracing out the converging lines of a bull flag continuation pattern within that channel
Key Technical Levels for S&P 500 (SPX)
The levels below define the immediate reaction zone for the S&P 500 and the broader structure surrounding the current setup.
Resistance Levels
| Resistance Type | Price Level | Notes |
|---|---|---|
| Immediate Resistance | 7,757.63 | Near-term resistance within the consolidation range |
| Key Resistance | 7,816.70 | Recent weekly high |
| Major Resistance | 7,857.62 | Fibonacci 1.618 extension |
Support Levels
| Support Type | Price Level | Notes |
|---|---|---|
| Immediate Support | 7,674.36 | Near-term support within the consolidation range |
| Key Support | 7,620.90 | Change-of-Polarity support – former key resistance |
| Major Support | 7,580.05 | Deeper structural support level |
Summary: S&P 500 Technical Outlook
This S&P 500 (SPX) educational technical chart analysis for the week of September 7 to 11, 2026 identifies an index in a strong uptrend, trading near record highs while consolidating within a developing bull flag continuation pattern. RSI holding repeatedly above 60, combined with price finding support at the former resistance level of 7,620.90, together describe a structure that remains constructive so long as this Change-of-Polarity zone continues to hold.
The critical zone to watch this week is the 7,620.90 to 7,816.70 range. A sustained move through 7,816.70 and toward the 7,857.62 Fibonacci 1.618 extension would reinforce the continuation setup, while a break back below 7,620.90 would open the door to a deeper pullback toward the 7,580.05 major support level. Either way, the RSI 60 level remains the key momentum reference for distinguishing continuation from a more meaningful pause in the uptrend.
- SPX consolidating near record highs within a developing bull flag pattern
- 7,620.90 has converted from resistance into a Change-of-Polarity support zone
- RSI at 64.23, holding above the 60 momentum threshold on multiple retests
- Critical zone for the week: 7,620.90 to 7,816.70
- 7,857.62 (Fibonacci 1.618) is the key upside reference if the range breaks higher
Want Expert Analysis on a Specific Asset?
Request a custom weekly chart interpretation of Equities, Cryptos, Commodities & Indices from Chartrick’s team of experienced technical analysts. Delivered to your inbox within 2 working days.
Important Disclaimer
All content on Chartrick, including charts, analysis reports, articles, and educational materials, is provided for general informational and educational purposes only. Nothing on this platform constitutes investment advice, financial advice, trading advice, or any recommendation to buy, sell, or hold any financial instrument. Financial markets carry risk, and past chart analysis does not guarantee future performance. All analysis is based on publicly available market data and is subject to change at any time. While every effort is made to ensure accuracy, Chartrick does not accept liability for any loss, damage, or financial outcome arising directly or indirectly from use of or reliance on this content, including any errors or omissions in the analysis. Users are solely responsible for their own investment and trading decisions and should exercise their own independent judgment.





