
S&P 500 Index (SPX) | Published by Chartrick’s Team of Experienced Technical Analysts
Opening paragraph
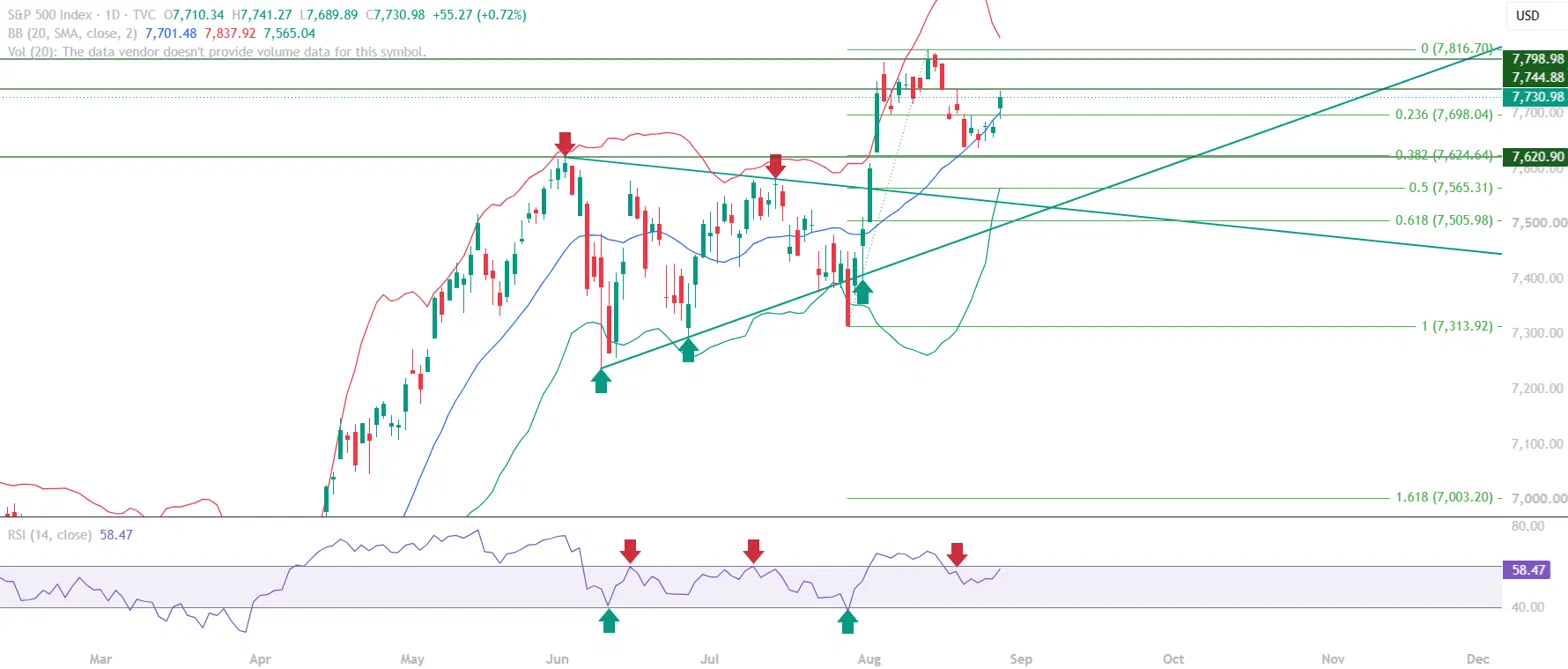
In markets today, the S&P 500 Index (SPX) educational technical chart analysis for 28 August 2026 examines a market that has moved from its recent rally into a consolidation phase. Today’s S&P 500 closed at 7,730.98, holding above the Mid Bollinger Band at 7,701.48 and above the Fibonacci 0.236 retracement at 7,698.04, both of which point to underlying strength even as the index digests recent gains. S&P today shows RSI at 58.47, edging closer to the key 60 momentum threshold that would confirm continuation of the broader bullish trend.
This phase follows a strong rally that pushed price up toward the recent high near 7,816.70 (Fibonacci 0), after which the index pulled back into a corrective, sideways structure. Since then, price has held the 7,698 – 7,701 confluence zone, while RSI has shifted into the 40-60 range typical of consolidation rather than trend continuation or reversal. The current structure describes a market pausing within an intact uptrend, with direction likely to be decided by whether price clears the recent high and RSI sustains above 60.
All content on this page is educational technical chart analysis provided for informational purposes only. It does not constitute investment advice or any recommendation to buy, sell, or hold any financial instrument.
What Does the Current S&P 500 Chart Structure Show?
The daily S&P 500 chart shows price consolidating above the Mid Bollinger Band at 7,701.48, with the broader uptrend structure still intact on the longer-term timeframe. This is an early sign of continued underlying strength rather than confirmation of fresh upside – the recent high still needs to be decisively cleared and held for the structure to shift from consolidation back into an active rally.
The critical zone for today’s S&P 500 sits between 7,698.04 and 7,798.98, the immediate reaction area where price is currently trading. This band contains the immediate support confluence at 7,698 – 7,701 (Fibonacci 0.236 + Mid Bollinger Band) below, immediate resistance at 7,744.88 within the range, and key resistance at 7,798.98 near its upper edge. How price behaves within this range over the coming sessions will shape whether the index resumes its climb toward the 7,816.70 recent high or slips back to retest support.
- Price is consolidating after a strong rally, with the broader uptrend structure intact
- Price is holding above the Fibonacci 0.236 retracement at 7,698.04
- Price is sustaining above the Mid Bollinger Band at 7,701.48, a near-term support reference
- RSI has shifted into the 40-60 zone, consistent with a consolidation phase rather than a trend break
The 7,698 – 7,798 Critical Zone
This zone matters because it is where today’s S&P 500 consolidation meets its next real test. A close that holds above 7,698.04 keeps the Fibonacci 0.236 + Mid Bollinger Band confluence intact as support and preserves the broader bullish structure, while a sustained move through 7,798.98 and the 7,816.70 recent high would open the door to fresh upside. Markets rarely resolve a consolidation phase in a single session, and this range is where profit-taking from the recent rally and fresh buying interest at support are actively contesting control. How price closes within this zone in the sessions ahead will say more about the durability of the uptrend than any single day’s move.
How Are the Technical Indicators Reading?
RSI in this S&P 500 educational technical chart analysis stands at 58.47, having made a range shift into the 40-60 zone that is typical of short-term consolidation. A sustained move above RSI 60 is the momentum confirmation this setup still needs; without it, the index remains in a corrective, sideways phase inside the broader uptrend rather than resuming active trend continuation.
On the Bollinger Bands, price is sustaining above the Mid Band at 7,701.48, one of the clearer signs of near-term strength in this structure. The Fibonacci retracement grid places the 0, 0.236, 0.382, 0.5 and 0.618 levels at 7,816.70, 7,698.04, 7,624.64, 7,565.31 and 7,505.98 respectively, and price is currently holding above the first retracement level.
- RSI at 58.47, within the 40-60 consolidation range and approaching the key 60 zone
- A sustained close above RSI 60 is needed to confirm continuation of the broader bullish trend
- Mid Bollinger Band at 7,701.48 sits just below current price, acting as a supportive reference
- Fibonacci 0.236 at 7,698.04 is holding as support, with 7,816.70 the recent high above
Key Technical Levels for the S&P 500 (SPX)
The following levels are identified in this S&P 500 educational technical chart analysis. All levels are derived from expert chart analysis using publicly available market data.
Resistance Levels
| Resistance Type | Price Level | Notes |
|---|---|---|
| Immediate Resistance | 7,744.88 | Near-term ceiling within the consolidation range |
| Key Resistance | 7,798.98 | Above CMP, not yet tested today |
| Major Resistance | 7,816.70 | Recent high / Fibonacci 0 |
Support Levels
| Support Type | Price Level | Notes |
|---|---|---|
| Immediate Support | 7,698.04 – 7,701.48 | Confluence of Fibonacci 0.236 and Mid Bollinger Band |
| Key Support | 7,620.90 | Below CMP, next reference on a deeper pullback |
| Major Support | 7,565.31 | Fibonacci 0.50 retracement |
Summary: S&P 500 Technical Outlook
This S&P 500 (SPX) educational technical chart analysis for 28 August 2026 identifies a market pausing within an intact broader uptrend. The hold above the Mid Bollinger Band, the sustained position above the Fibonacci 0.236 retracement, and RSI’s shift into the 40-60 consolidation zone together describe today’s S&P 500 as digesting its recent rally rather than reversing it.
The 7,698.04 – 7,798.98 zone is the near-term battleground: a sustained move above 7,744.88 followed by a breakout through 7,798.98 and the 7,816.70 recent high would provide stronger confirmation of trend continuation, while a slip back below 7,698.04 would call the near-term strength into question and point back toward 7,620.90 and 7,565.31. The long-term uptrend is considered intact unless key support levels are decisively broken on a sustained basis, so how markets today close within this critical zone carries real weight for the near-term picture.
- The S&P 500 (SPX) trades at 7,730.98 (as closed on 28 August 2026), above key support
- Price is holding above both the Mid Bollinger Band and the Fibonacci 0.236 retracement
- RSI at 58.47 is approaching the key 60 level needed to confirm continued bullish momentum
- The critical zone to watch is 7,698.04 (immediate support) to 7,798.98 (key resistance)
- The broader uptrend stays intact unless key support levels are decisively broken and held
Want Expert Analysis on a Specific Asset?
Request a custom daily chart interpretation of Equities, Cryptos, Commodities & Indices from Chartrick’s team of experienced technical analysts. Delivered to your inbox within 2 working days.
Important Disclaimer
All content on Chartrick, including charts, analysis reports, articles, and educational materials, is provided for general informational and educational purposes only. Nothing on this platform constitutes investment advice, financial advice, trading advice, or any recommendation to buy, sell, or hold any financial instrument. Financial markets carry risk, and past chart analysis does not guarantee future performance. All analysis is based on publicly available market data and is subject to change at any time. While every effort is made to ensure accuracy, Chartrick does not accept liability for any loss, damage, or financial outcome arising directly or indirectly from use of or reliance on this content, including any errors or omissions in the analysis. Users are solely responsible for their own investment and trading decisions and should exercise their own independent judgment.





