
Market Overview
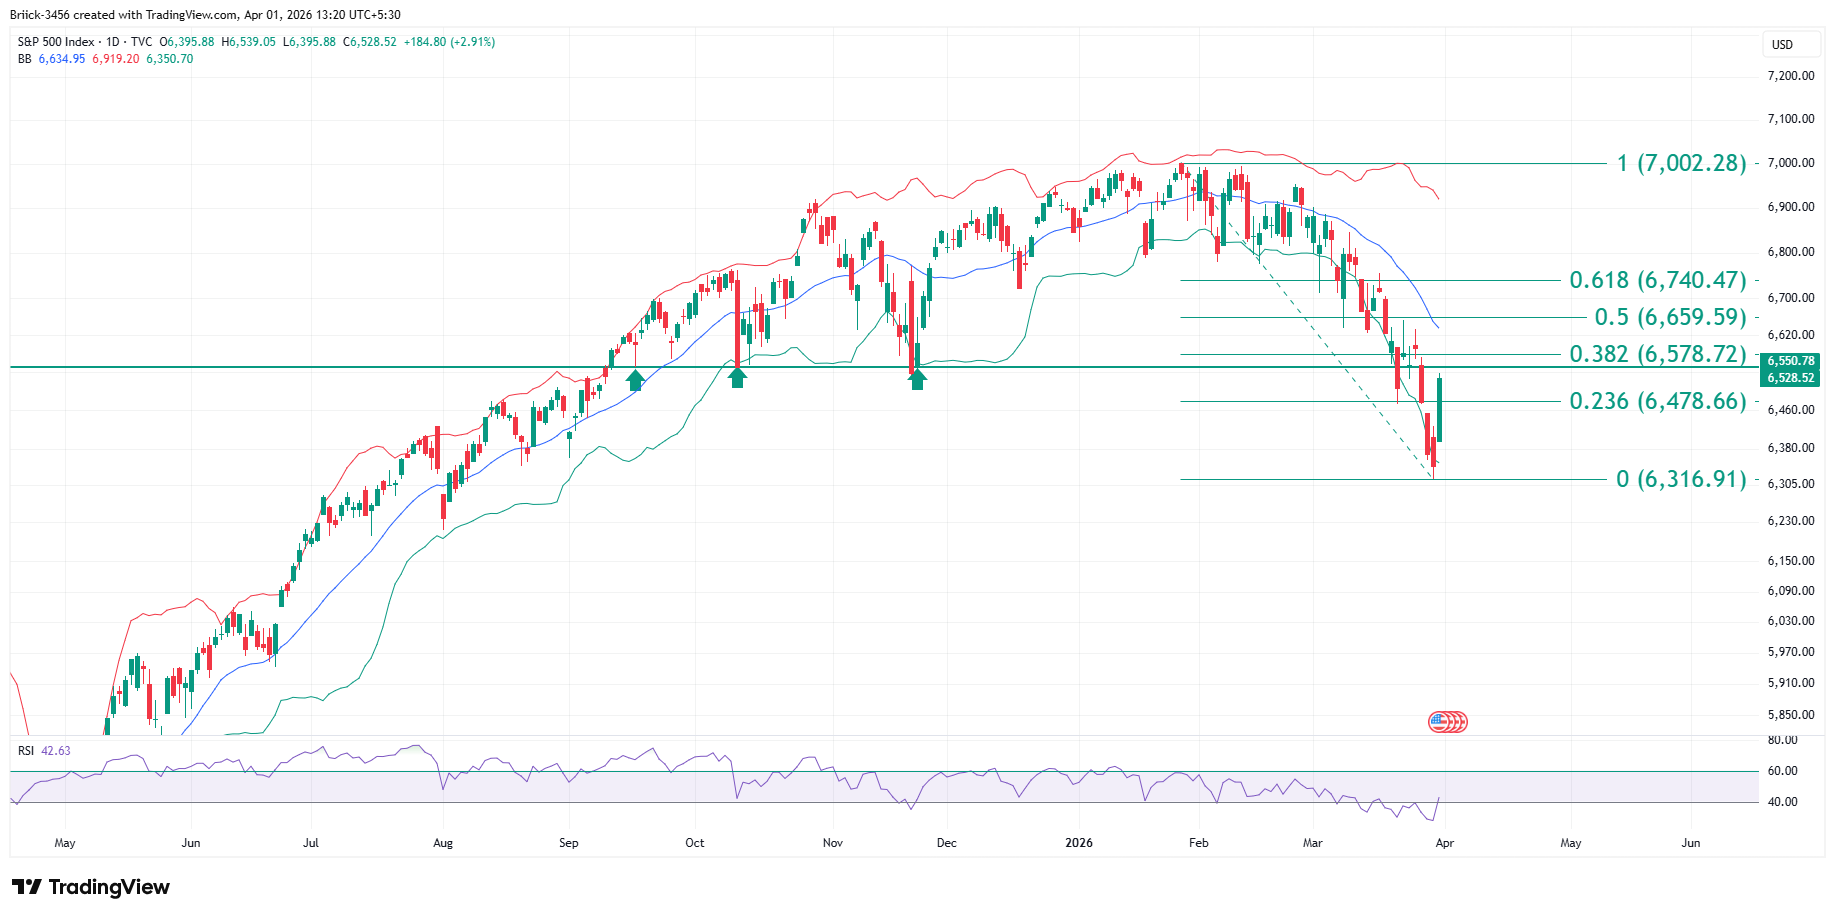
The S&P 500 technical analysis for 1 April 2026 reveals a market in recovery mode, with the benchmark US equity index staging a notable bounce from recent lows. In today’s educational technical chart analysis, Chartrick examines the current S&P 500 market structure, which shows price breaking above the critical 6,478.66 level — the 0.236 Fibonacci retracement — signaling a short-term shift in momentum.
The S&P 500 chart analysis indicates that the index rallied sharply from the 6,316.91 low, reclaiming key technical territory. Price is now approaching the 6,550.78 zone, a level that previously served as strong support on multiple occasions and may now act as resistance. This support-to-resistance transition is a key structural observation in today’s S&P 500 market analysis.
Chart Analysis
The S&P 500 technical chart analysis reveals a bounce phase within a broader corrective structure. Price action shows a sharp recovery from the 6,316.91 level, with the index reclaiming the 6,478.66 Fibonacci support zone. The current chart interpretation suggests the market is building short-term strength, with early signs of higher high and higher low formation emerging on the daily timeframe.
The market structure analysis shows accumulation behavior visible near lower levels, consistent with a recovery phase. The index is now testing the 6,550.78 resistance zone, where previous support has transitioned to resistance — a classic technical pattern that will determine the next phase of price action.
Technical Indicators
RSI (Relative Strength Index) has crossed above the 40 level, a significant momentum development in today’s S&P 500 technical analysis. The RSI 40 level now serves as a key momentum support zone — sustaining above this level indicates retention of improving momentum, while a breakdown below 40 could signal weakening trend strength.
The Bollinger Bands analysis shows price approaching the Mid Bollinger Band near 6,634.95, which may act as a dynamic resistance zone. The Fibonacci retracement framework provides additional structure: the 0.382 level at 6,578.72 represents immediate resistance, while the 0.5 level at 6,659.59 marks key resistance above.
Market Structure
The S&P 500 market structure reflects a recovery phase within a broader corrective context. Short-term structure shows a bounce with early signs of base formation, while the medium-term picture shows consolidation with accumulation at lower levels. The broader long-term uptrend structure remains intact, with any pullback occurring within a continuing uptrend context.
Key Technical Levels
| Level Type | Price Level | Context |
| Resistance 3 | 6,659.59 | Fibonacci 0.5 — Key resistance |
| Resistance 2 | 6,634.95 | Mid Bollinger Band — Dynamic resistance |
| Resistance 1 | 6,550.78 | Previous support turned resistance |
| Support 1 | 6,478.66 | Fibonacci 0.236 — Immediate support |
| Support 2 | 6,316.91 | Major support — Recent low |
Summary
The S&P 500 educational technical chart analysis for 1 April 2026 shows a market in recovery mode, with improving momentum and price reclaiming key technical levels. The 6,550.78 to 6,634.95 resistance zone will be critical in determining whether the recovery extends or faces rejection. This educational technical chart analysis is designed to support informed decision-making.
Disclaimer
All content on Chartrick, including charts, analysis reports, articles, and educational materials, is provided for general informational and educational purposes only. Nothing on this platform constitutes investment advice, financial advice, trading advice, or any recommendation to buy, sell, or hold any financial instrument. Financial markets carry risk, and past chart analysis does not guarantee future performance. Chartrick will not accept liability for any loss or damage arising from use of or reliance on this content. Users are solely responsible for their own investment decisions.
Want expert educational technical chart analysis for a specific asset? → Go to Get Custom Chart Analysis Page.