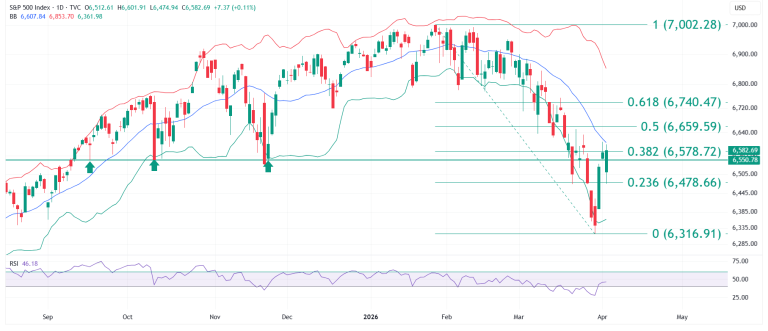
S&P 500: Fibonacci Bounce Tests Mid Bollinger Band Resistance
S&P 500 educational technical chart analysis for April 6, 2026 identifies a sharp recovery from the Fibonacci 0.236 support at 6,478.66.

S&P 500 educational technical chart analysis for April 6, 2026 identifies a sharp recovery from the Fibonacci 0.236 support at 6,478.66.





