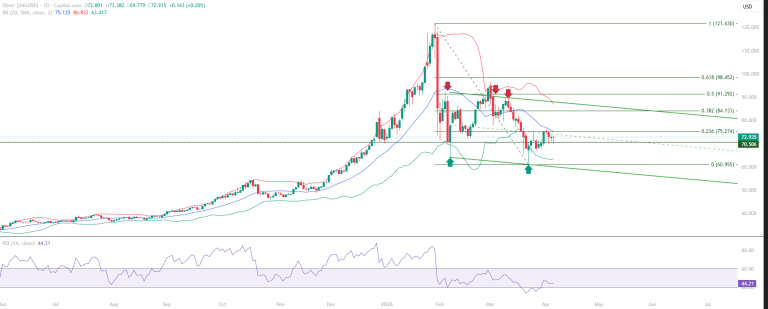
Silver (XAGUSD): 70.506 Resistance-to-Support Flip Holds Structure
This Silver chart analysis examines the recovery from the 60.955 base: the rally to 76.107 established the initial advance.

This Silver chart analysis examines the recovery from the 60.955 base: the rally to 76.107 established the initial advance.
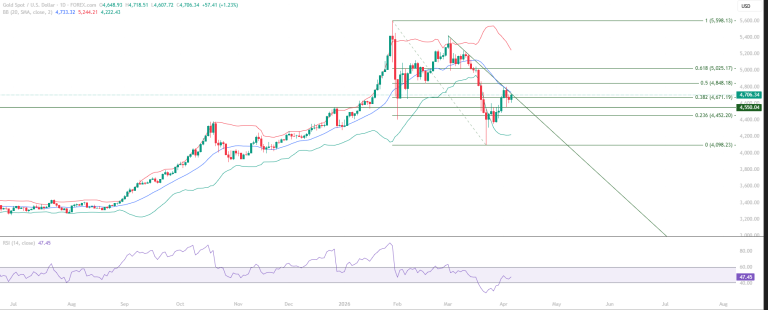
Gold educational technical chart analysis identifies a sharp recovery structure following a decisive retest of the 4,550 support level.
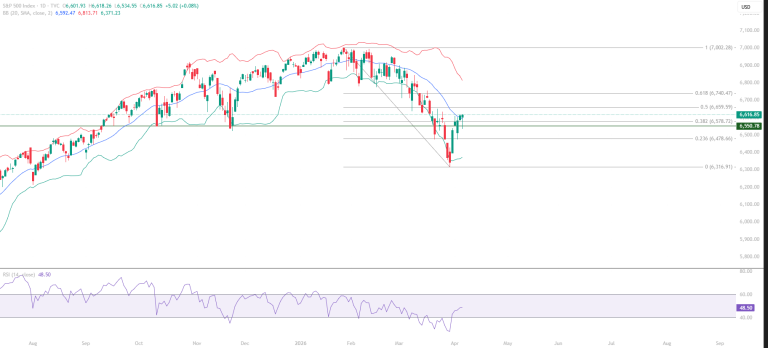
This S&P 500 chart analysis identifies the 6,659.59 Fibonacci 0.50 as the primary resistance test ahead.
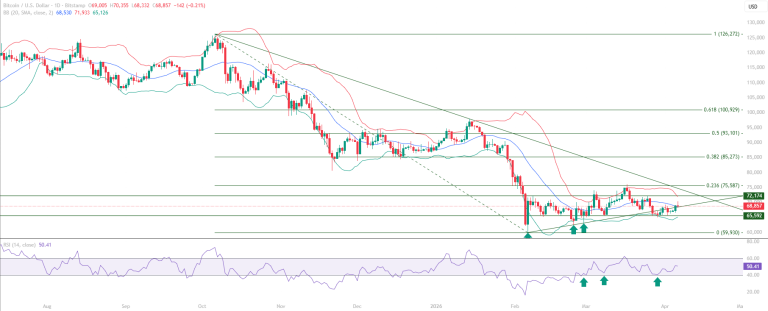
This Bitcoin chart analysis examines the 65,592 to 72,174 zone as the immediate reaction area within the broader 59,930 to 75,587 consolidation range.
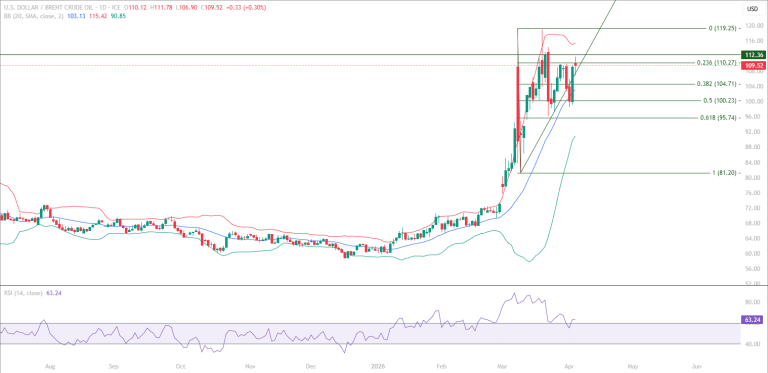
This Brent Crude Oil chart analysis examines the significance of the 104.71 level (Fibonacci 0.382). From resistance to support
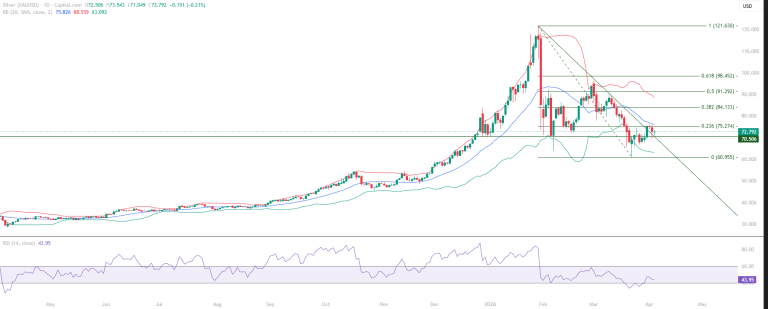
This Silver chart analysis examines the quality of each development. The 70.506 polarity change is confirmed - not implied.





