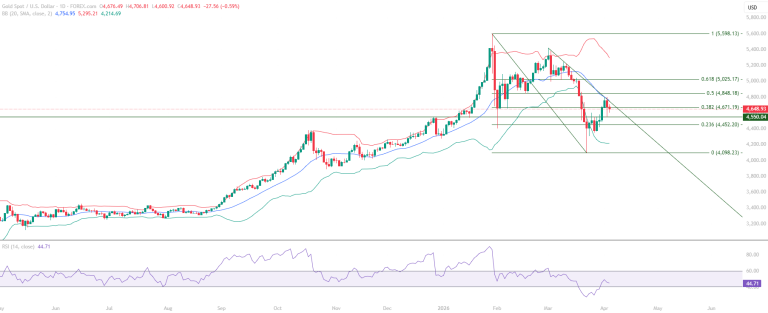
Gold (XAUUSD): 4,550 Support Holds as RSI Retests 40
Gold (XAUUSD) educational technical chart analysis identifies a strong recovery structure from the 4,550 support level

Gold (XAUUSD) educational technical chart analysis identifies a strong recovery structure from the 4,550 support level
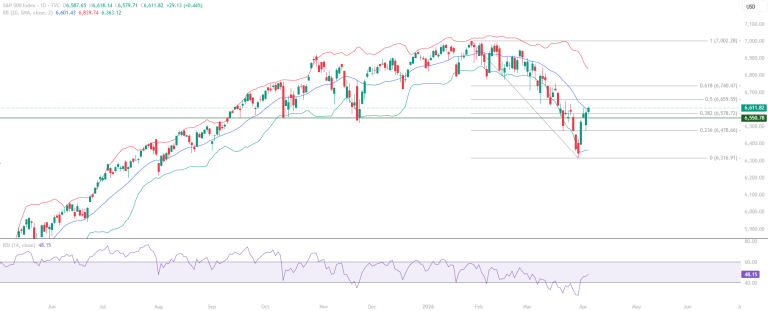
S&P 500 , the simultaneous testing of RSI 40 and the price interaction with the Mid Bollinger Band at 6,601.43 is a confluent structural event.
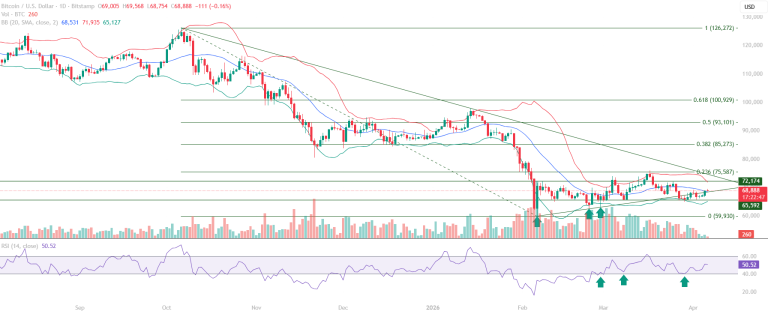
This Bitcoin chart analysis examines the structural significance of the RSI 40 pattern observed in the current consolidation.
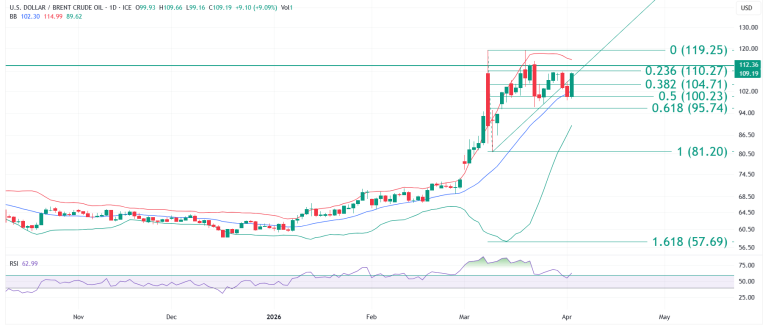
This Brent Crude Oil chart analysis emphasises on : rebound from the 100 level, the trendline reclaim, and the RSI break above 60.
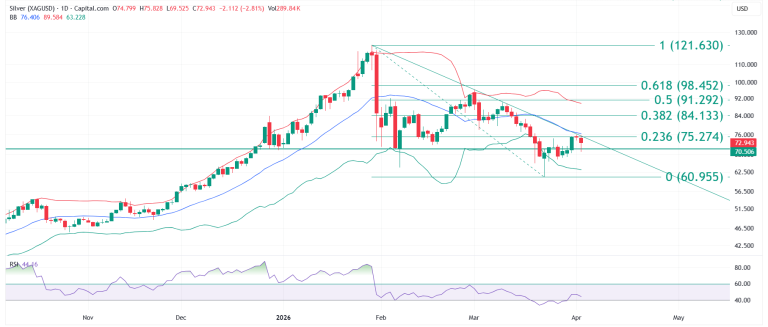
Silver analysis identifies the 70.506 resistance-to-support transition as the defining structural development of the current phase.
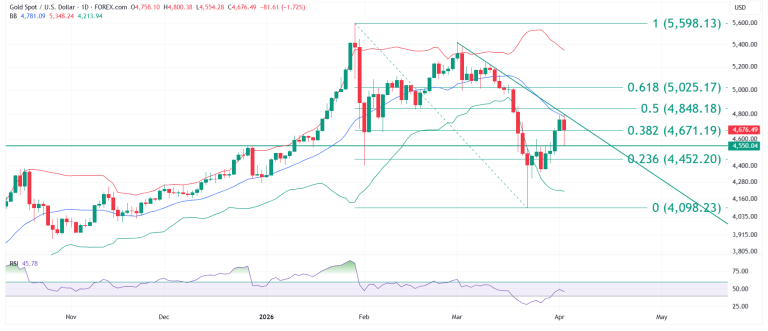
Gold analysis identifies a sharp recovery from the 4,550 support level, with price rallying from the 4,100 low to the 4,800 zone.





