
Market Overview
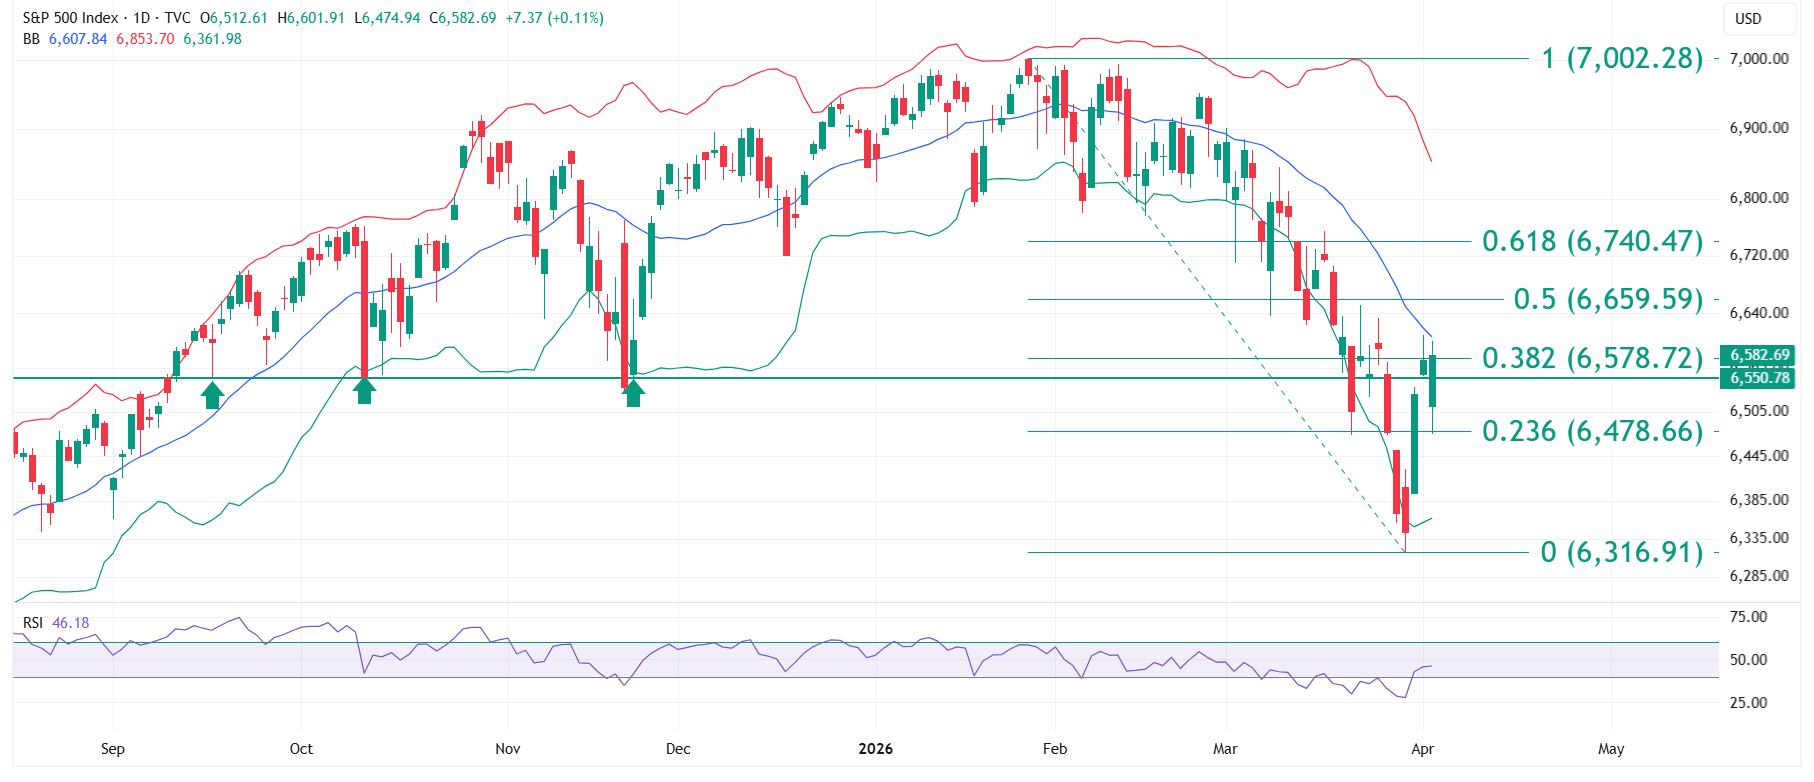
Today’s S&P 500 technical analysis examines a recovery phase that is testing critical resistance levels on the daily chart. The S&P 500 index has staged a sharp bounce from the 6,478.66 support level, the 0.236 Fibonacci retracement, and reclaimed the 0.382 Fibonacci level at 6,578.72. This educational technical chart analysis explores whether the current momentum is sufficient to push through the Mid Bollinger Band resistance near 6,607.84.
The S&P 500 market analysis reveals improving short-term momentum following a decline from January 2026 highs. The rally from 6,316.91 to 6,609.67 has pushed price above the previously multi-tested 6,550.78 level, which may now transition from resistance to support, a structural development worth monitoring closely.
Chart Analysis
The daily candlestick chart reveals a bounce phase within a broader corrective structure. This S&P 500 chart analysis identifies early signs of higher high and higher low formation, with accumulation behavior visible near lower levels. Price structure is showing improving momentum, with the index closing above the 0.382 Fibonacci retracement at 6,578.72.
The S&P 500 trend structure shows a clear recovery from the 6,316.91 lows. However, the index remains within a corrective phase when viewed against the January 2026 highs. The market structure analysis indicates that the current bounce is occurring within a broader consolidation, and the reaction at the Mid Bollinger Band level will be critical in determining whether the recovery extends or reverses.
Technical Indicators
RSI Analysis: The Relative Strength Index has retested the 40 level and is holding above it. RSI 40 has historically acted as a momentum support zone during recovery phases in the S&P 500. Sustaining above this level suggests bullish momentum retention, while a breakdown below 40 would signal weakening trend strength and potential downside continuation.
Bollinger Bands: Price is approaching the Mid Bollinger Band at 6,607.84, which is acting as dynamic resistance in the near term. A close above this level would signal improving strength in the S&P 500 technical analysis outlook. This educational technical chart analysis uses Bollinger Bands to identify dynamic support and resistance zones that shift with market volatility.
Key Technical Levels
| Level Type | Price Level | Notes |
| Major Resistance | 6,740.47 | Fibonacci 0.618 retracement level |
| Key Resistance | 6,659.59 | Fibonacci 0.50 retracement level |
| Immediate Resistance | 6,607.84 | Mid Bollinger Band; dynamic resistance zone |
| Immediate Support | 6,578.72 | Fibonacci 0.382 retracement level |
| Key Support | 6,550.78 | Former multi-touch support now being retested |
| Strong Support | 6,478.66 | Fibonacci 0.236 retracement; recent bounce origin |
Summary
This S&P 500 educational technical chart analysis identifies a recovery phase with improving momentum indicators. The 6,550.78 to 6,607.84 zone is the critical range where market behavior will determine continuation or rejection. The broader uptrend structure remains intact on the long-term timeframe, and the current corrective phase reflects consolidation with accumulation at lower levels. This educational technical chart analysis is designed to support informed decision-making.
Disclaimer: All content on Chartrick, including charts, analysis reports, articles, and educational materials, is provided for general informational and educational purposes only. Nothing on this platform constitutes investment advice, financial advice, trading advice, or any recommendation to buy, sell, or hold any financial instrument. Financial markets carry risk, and past chart analysis does not guarantee future performance. Chartrick will not accept liability for any loss or damage arising from use of or reliance on this content. Users are solely responsible for their own investment decisions.
Want expert educational technical chart analysis for a specific asset? Get Custom Chart Analysis at chartrick.com/custom-chart-analysis