
Daily Analysis
S&P 500 (SPX) | Published by Chartrick’s Team of Experienced Technical Analysts
Opening paragraph
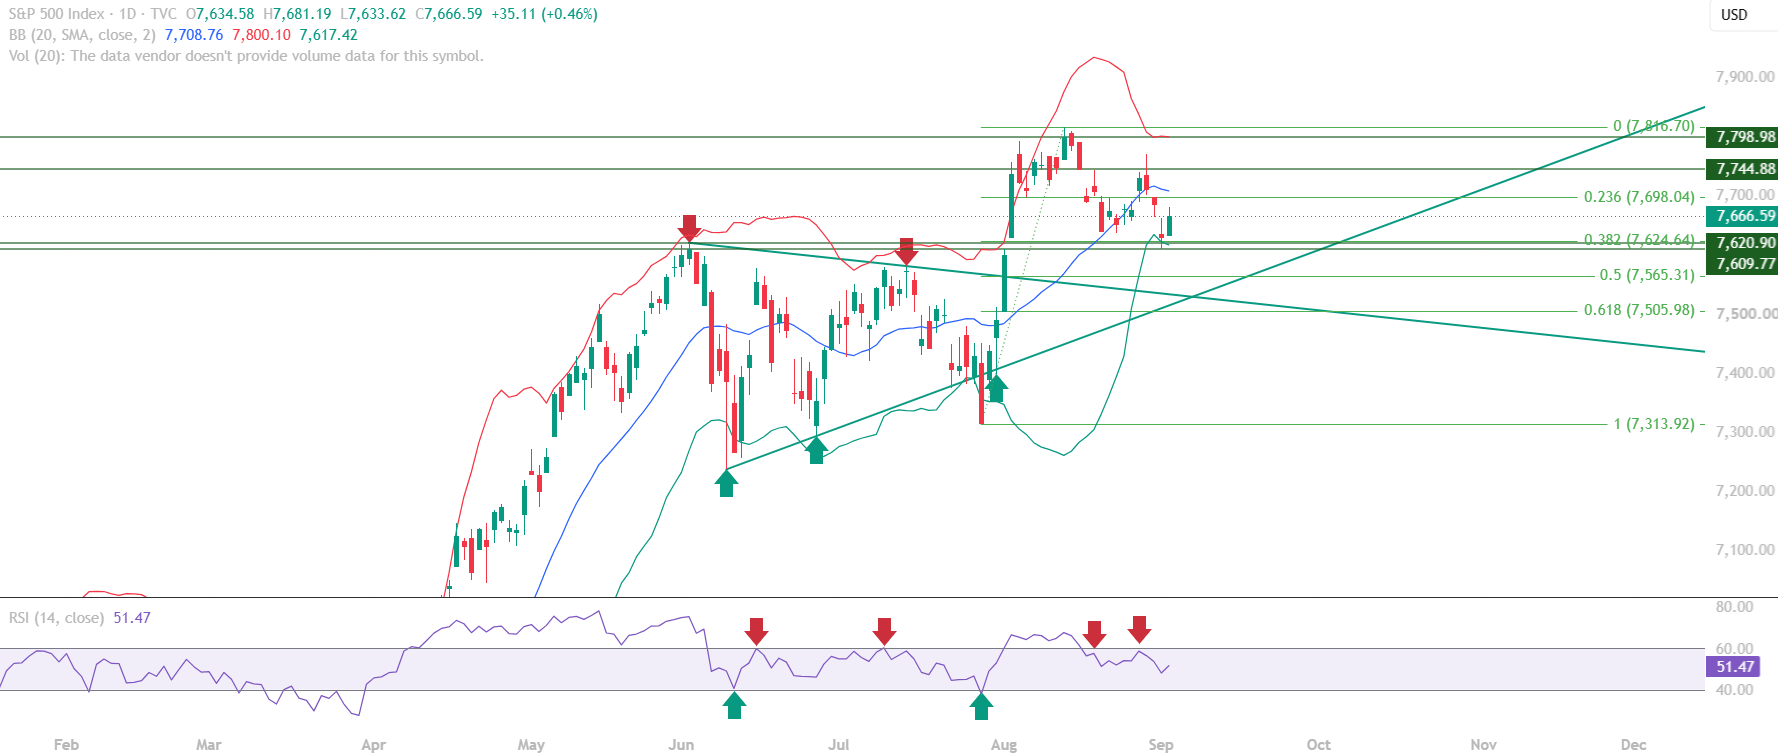
In today’s S&P 500 market, the index (SPX) is working through a consolidation phase after a strong multi-week rally carried price to a recent high near 7,798.98. The S&P 500 today is trading at 7,666.59, sitting below the Mid Bollinger Band at 7,708.76, with price drifting toward the confluence of the 0.382 Fibonacci retracement at 7,624.64 and the former Change of Polarity level at 7,620.90. That overlap is forming an important potential support zone just beneath current price.
This pullback follows a rally that carried the index through a sequence of higher highs, pushing RSI well above the 60 momentum threshold along the way. The current cooling-off period has brought RSI back into the 40-60 range, a pattern consistent with a broader uptrend pausing to digest gains rather than reversing outright. Today’s S&P 500 price action is best read against that longer rally, not in isolation.
All content on this page is educational technical chart analysis provided for informational purposes only. It does not constitute investment advice or any recommendation to buy, sell, or hold any financial instrument.
What Does the Current S&P 500 (SPX) Chart Structure Show?
The daily S&P 500 chart shows price retreating from the recent high and settling back below the Mid Bollinger Band at 7,708.76, which is now acting as the nearest overhead resistance. Below current price, the 0.382 Fibonacci retracement at 7,624.64 lines up closely with the prior Change of Polarity level at 7,620.90, creating a support confluence that technical traders will be watching closely if the pullback extends.
Beyond that first support band, the broader uptrend structure remains intact. The Key Support at 7,609.77 sits just below the confluence zone, while the 0.500 Fibonacci retracement at 7,565.31 marks the next major reference point further down. On the resistance side, 7,698.04 and 7,708.76 form a tight overhead band, with 7,744.88 and the recent high at 7,798.98 as the levels that would need to be reclaimed to reassert the earlier bullish momentum.
- Price trading below the Mid Bollinger Band at 7,708.76, which is acting as near-term resistance
- 0.382 Fibonacci retracement at 7,624.64 aligning with the Change of Polarity level at 7,620.90 to form a support confluence
- Key Support sits at 7,609.77, just beneath the confluence zone
- Immediate Resistance at 7,698.04 is the first level price needs to reclaim
- Recent high at 7,798.98 remains the major resistance that would confirm a resumption of the broader uptrend
Why the 7,624-7,620 Confluence Matters
A single support level holding is often just a pause; two independent technical signals converging on the same price band is a stronger structural tell. Here, a Fibonacci retracement level and a prior Change of Polarity level, a former resistance zone that flipped to support earlier in the uptrend, are lining up within a few points of each other around 7,620 to 7,624. That overlap is why this zone carries more weight than an isolated Fibonacci or trendline level would on its own. If price reaches this area, how it behaves there will say a lot about whether the broader uptrend still has buyers willing to defend it.
How Are the Technical Indicators Reading?
RSI on the daily S&P 500 chart is currently at 51.47, comfortably inside the 40-60 zone that has defined this consolidation phase. That range shift down from the elevated readings seen during the rally reflects cooling momentum rather than a breakdown, since RSI has not dropped meaningfully below the midpoint of the range.
The 60 level remains the key momentum threshold to watch. A sustained move back above it, paired with a reclaim of the overhead resistance band between 7,698.04 and 7,708.76, would be the clearest technical signal that the broader bullish structure is reasserting itself. Until then, price sitting below the Mid Bollinger Band keeps the near-term bias tilted toward consolidation.
- RSI at 51.47, inside the 40-60 consolidation range
- A sustained RSI move above 60 would strengthen the broader bullish structure
- Mid Bollinger Band at 7,708.76 is acting as near-term resistance
- Price remains below the Mid Band, consistent with a corrective or consolidation phase
Key Technical Levels for S&P 500 (SPX)
The following levels are identified in this S&P 500 educational technical chart analysis. All levels are derived from expert chart analysis using publicly available market data.
Resistance Levels
| Resistance Type | Price Level | Notes |
|---|---|---|
| Immediate Resistance | 7,698.04 | Fibonacci 0.236 retracement |
| Strong Resistance | 7,708.76 | Mid Bollinger Band, current overhead level |
| Key Resistance | 7,744.88 | Key overhead structural level |
| Major Resistance | 7,798.98 | Recent high |
Support Levels
| Support Type | Price Level | Notes |
|---|---|---|
| Immediate Support | 7,624.64-7,620.90 | Fib 0.382 + Change of Polarity confluence |
| Key Support | 7,609.77 | Key structural support |
| Major Support | 7,565.31 | Fibonacci 0.500 retracement |
Summary: S&P 500 Technical Outlook
Today’s S&P 500 technical picture is one of a healthy pause within a larger uptrend rather than a change in structure. Price has cooled from the recent high at 7,798.98 into a consolidation phase below the Mid Bollinger Band, with RSI settling into the 40-60 zone alongside it.
The 7,624.64-7,620.90 confluence is the level to watch on the downside, with 7,609.77 as the next line of defense if that zone gives way. On the upside, reclaiming the 7,698.04-7,708.76 resistance band and pushing RSI back above 60 would be the combination that strengthens the case for the broader bullish structure resuming.
- S&P 500 (SPX) trades at 7,666.59, in a consolidation phase within a broader uptrend
- Price is below the Mid Bollinger Band at 7,708.76, the nearest overhead resistance
- Immediate support confluence sits at 7,624.64-7,620.90 (Fib 0.382 + Change of Polarity)
- RSI at 51.47 remains inside the 40-60 range, with 60 as the key momentum threshold
- Major resistance at 7,798.98 marks the recent high and the level that would confirm renewed bullish momentum
Want Expert Analysis on a Specific Asset?
Request a custom weekly chart interpretation of Equities, Cryptos, Commodities & Indices from Chartrick’s team of experienced technical analysts. Delivered to your inbox within 2 working days.
Important Disclaimer
All content on Chartrick, including charts, analysis reports, articles, and educational materials, is provided for general informational and educational purposes only. Nothing on this platform constitutes investment advice, financial advice, trading advice, or any recommendation to buy, sell, or hold any financial instrument. Financial markets carry risk, and past chart analysis does not guarantee future performance. All analysis is based on publicly available market data and is subject to change at any time. While every effort is made to ensure accuracy, Chartrick does not accept liability for any loss, damage, or financial outcome arising directly or indirectly from use of or reliance on this content, including any errors or omissions in the analysis. Users are solely responsible for their own investment and trading decisions and should exercise their own independent judgment.





