Bitcoin: Base Formation Tests Fibonacci 0.236
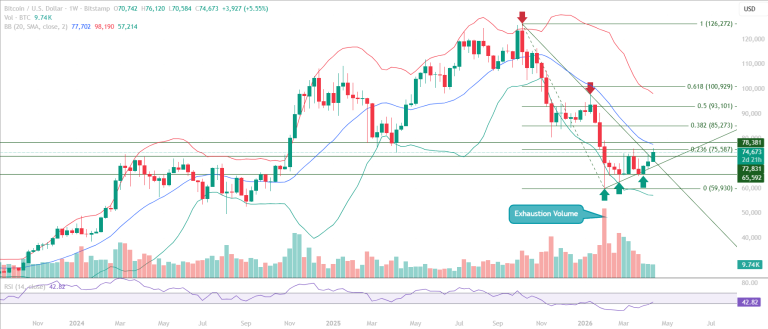
This Bitcoin chart analysis identifies the exhaustion volume signal from early February 2026 as the structural foundation for the current recovery.

This Bitcoin chart analysis identifies the exhaustion volume signal from early February 2026 as the structural foundation for the current recovery.
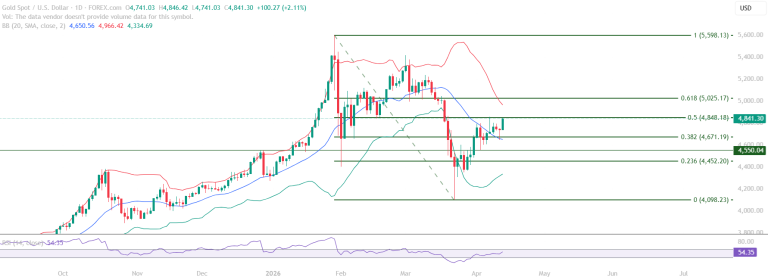
Gold chart analysis identifies a market in a defined bounce phase, approaching the Fibonacci 0.50 resistance at 4,848.18 with RSI at 54.35
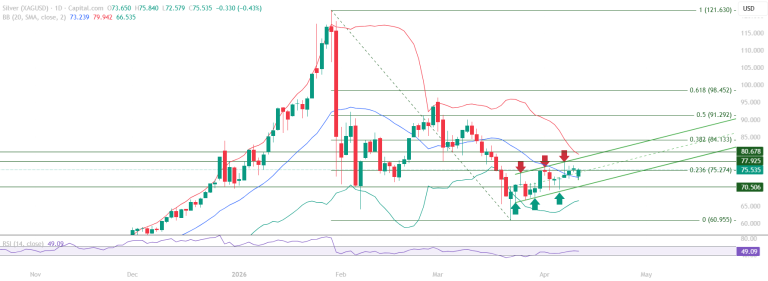
This Silver chart analysis examines the defining structural development: the 70.506 level has transitioned from a resistance zone to a support level.
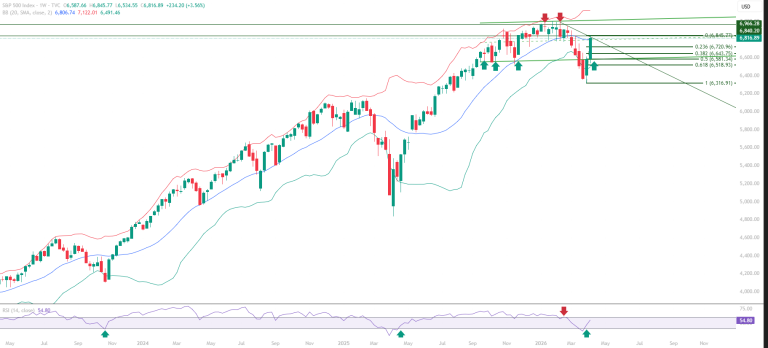
This S&P 500 chart analysis examines the quality of the recovery.The RSI has reclaimed the 40 level and is approaching the 60 threshold.
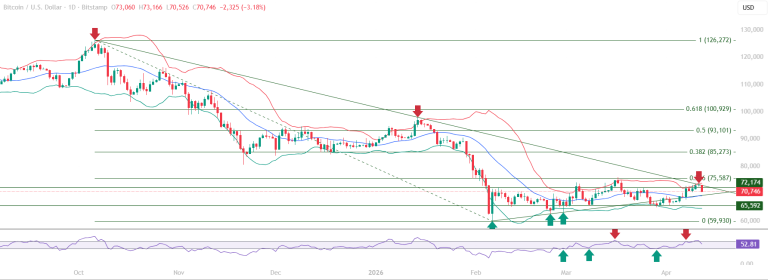
This Bitcoin chart analysis places the April 13 price action in its full structural context. The downward sloping trendline, formed during the broader corrective phase from prior highs, continues to act as the primary overhead resistance.
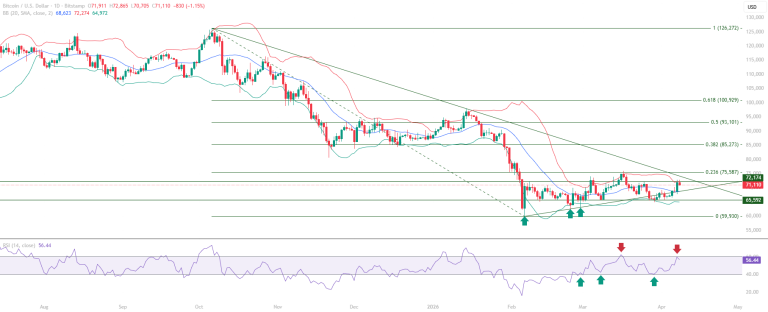
This Bitcoin chart analysis examines the quality of the current consolidation within the 59,930 to 75,587 range.The base formation pattern built over successive weeks continues to develop.
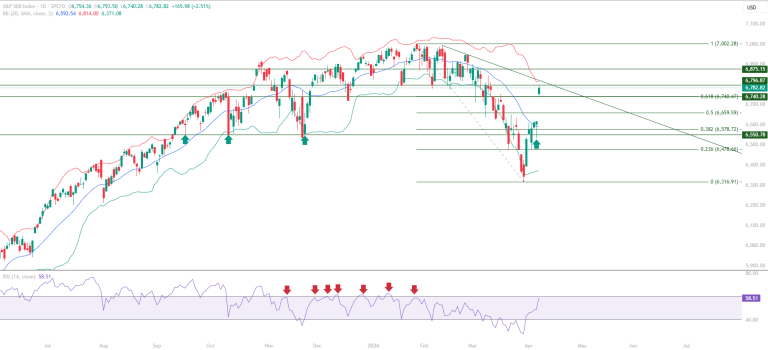
S&P 500 analysis identifies structural development: price has pushed decisively through the Fibonacci 0.618 retracement
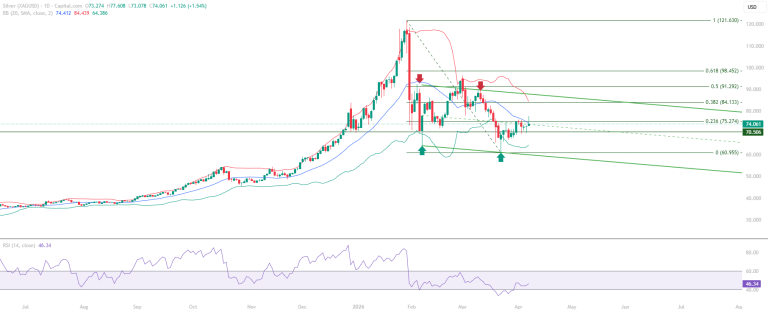
Silver educational technical chart analysis identifies a market approaching a structurally significant compressed resistance confluence.
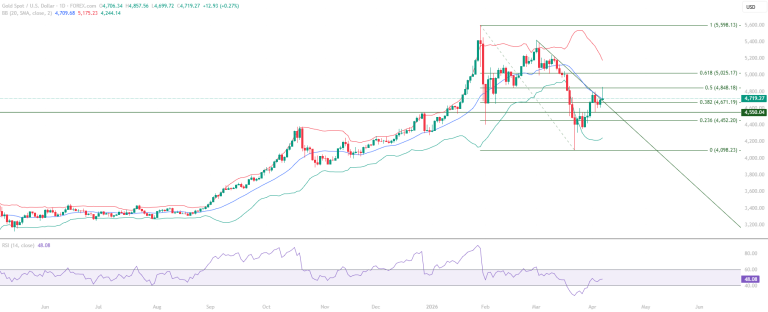
The Gold chart analysis: Implications of the Fibonacci 0.50 rejection, the interaction with the Mid Bollinger Band and downward sloping trendline.
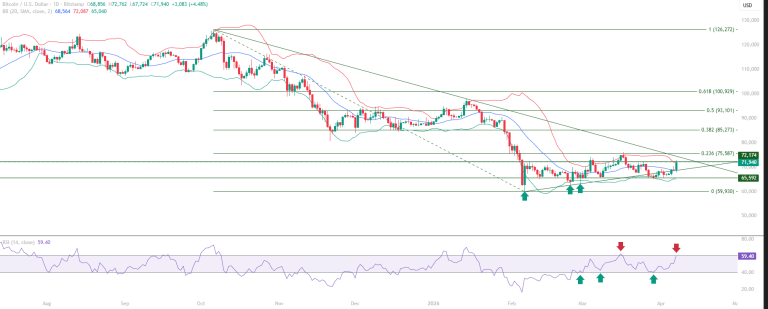
This Bitcoin chart analysis examines the base formation structure within the 59,930 to 75,587 consolidation range. The trendline reclaim is the defining structural event





