Silver (XAGUSD) 70.506 Resistance-to-Support Flip Holds as Recovery Builds
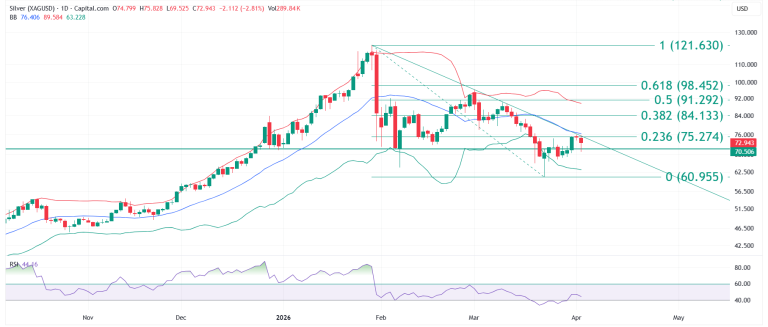
Silver analysis identifies the 70.506 resistance-to-support transition as the defining structural development of the current phase.

Silver analysis identifies the 70.506 resistance-to-support transition as the defining structural development of the current phase.
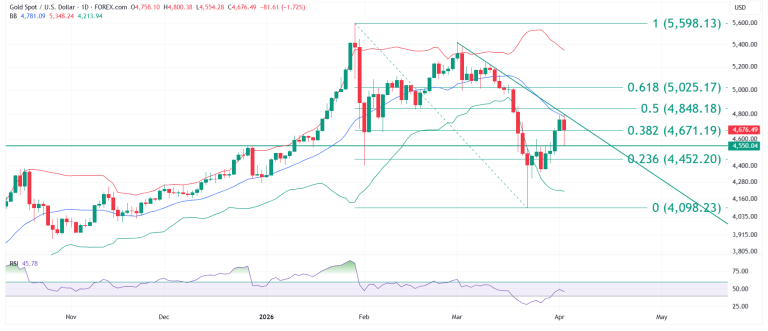
Gold analysis identifies a sharp recovery from the 4,550 support level, with price rallying from the 4,100 low to the 4,800 zone.
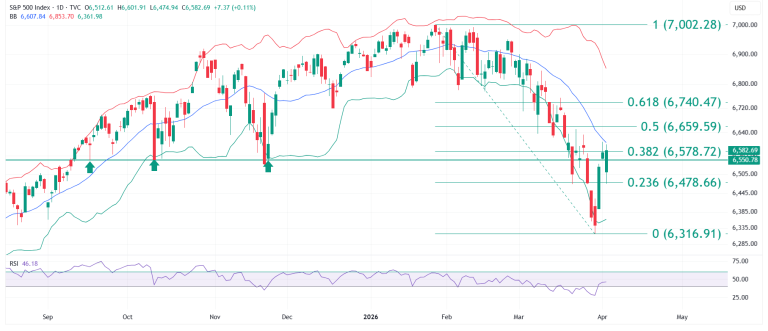
S&P 500 educational technical chart analysis for April 6, 2026 identifies a sharp recovery from the Fibonacci 0.236 support at 6,478.66.





