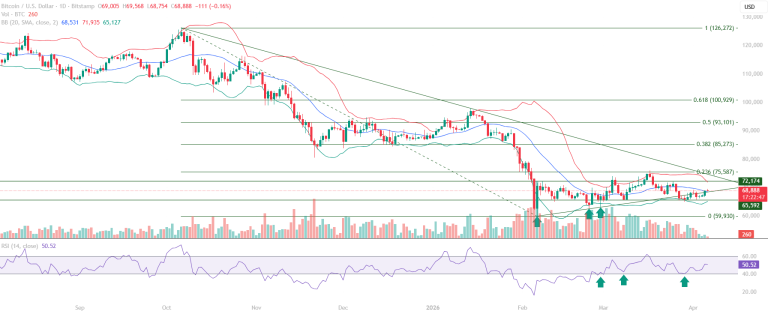
Bitcoin (BTC) Consolidation Base Formation as RSI Holds 40
This Bitcoin chart analysis examines the structural significance of the RSI 40 pattern observed in the current consolidation.

This Bitcoin chart analysis examines the structural significance of the RSI 40 pattern observed in the current consolidation.
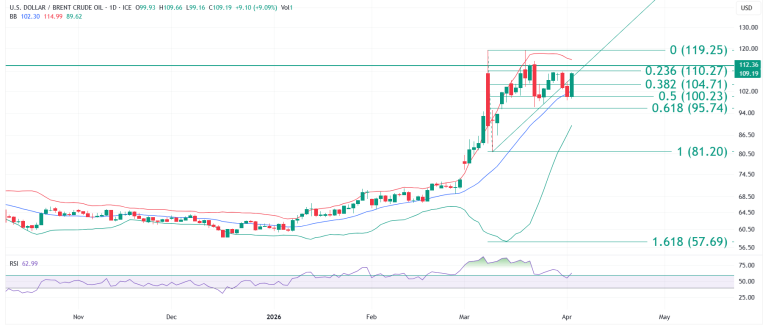
This Brent Crude Oil chart analysis emphasises on : rebound from the 100 level, the trendline reclaim, and the RSI break above 60.
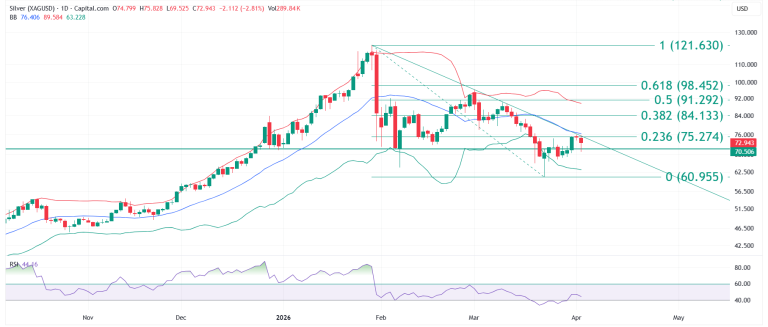
Silver analysis identifies the 70.506 resistance-to-support transition as the defining structural development of the current phase.
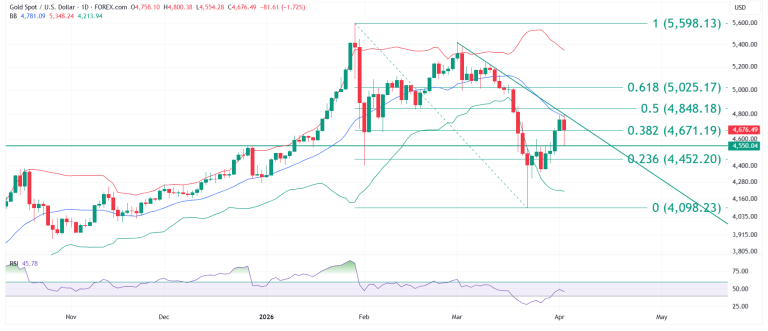
Gold analysis identifies a sharp recovery from the 4,550 support level, with price rallying from the 4,100 low to the 4,800 zone.
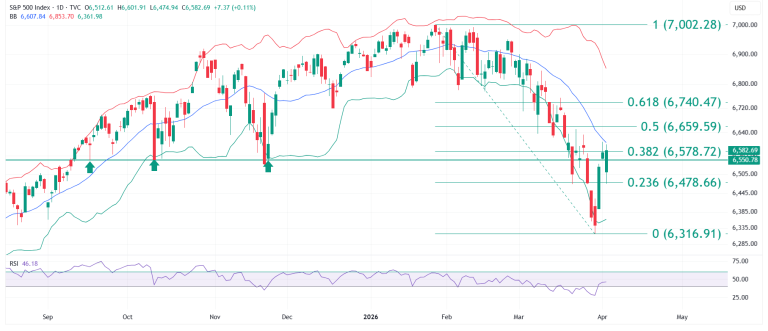
S&P 500 educational technical chart analysis for April 6, 2026 identifies a sharp recovery from the Fibonacci 0.236 support at 6,478.66.





